Register for an Oceans 2.0 account & get more features
- You can view Geospatial Map without logging in, but you need an account and permissions to view all of the data.
What is it?
The Geospatial Map lets you browse, preview and download CTD (Conductivity-Temperature-Depth) casts from the Community Fishers program.
Why is this useful?
This application is specially designed for the Community Fishers program, and has been built as a low-bandwidth friendly interface, which means it will perform better for people lacking high-speed Internet connections.
Large-scale overview

When started, the map includes casts from the Pacific, Arctic and Atlantic. Each blue marker indicates a cast location. (GEOVANY - WHAT DO THE NUMBERS INDICATE? LOCATION OR CAST? What do IS, PA, MAPC mean?) Zoom in to see locations of individual casts. (click to enlarge)
Zooming in

Zooming in to the local scale, octagons appear beneath each blue marker. Click the octagons to reveal pop-up displays of cast data. Click a pop-up graph to enlarge it. Learn more about this multi-profile plot format.
Cast data (in aligned and depth-binned format) can be downloaded directly by clicking DOWNLOAD .COR. (click to enlarge)
Narrowing the time window

Click the green icon in the bottom right of the map to display the Cast Date Filter pop-up, which allows you to search for casts between specific time frames on the map.
Click Clear Filter to empty all time fields and reset the map to show all casts
Switching base maps

Several different types of base map are available; switch the base map from the Layers icon in the lower-right corner. (click to enlarge)
Viewing multiple casts in one location

When multiple casts are available from a single location, click MORE to browse and preview them. The MORE pop-up window allows you to generate plots, download .COR files and view annotations. You can also select casts from this location for bulk download in the Data Search application. (click to enlarge)
Data products and annotations
When multiple casts are available from a single location, click MORE to browse and preview them. The MORE pop-up window allows you to generate plots, download .COR files and view annotations. You can also select casts from this location for bulk download in the Data Search application. (click to enlarge)

The annotations list displays any annotations made for the selected cast (not all casts have annotations). Filter according to desired options after clicking the three dots (⋮) icon in the top right corner. (click to enlarge)
Clicking away from the pop-up returns you to the Filtered Casts card.
Downloading data
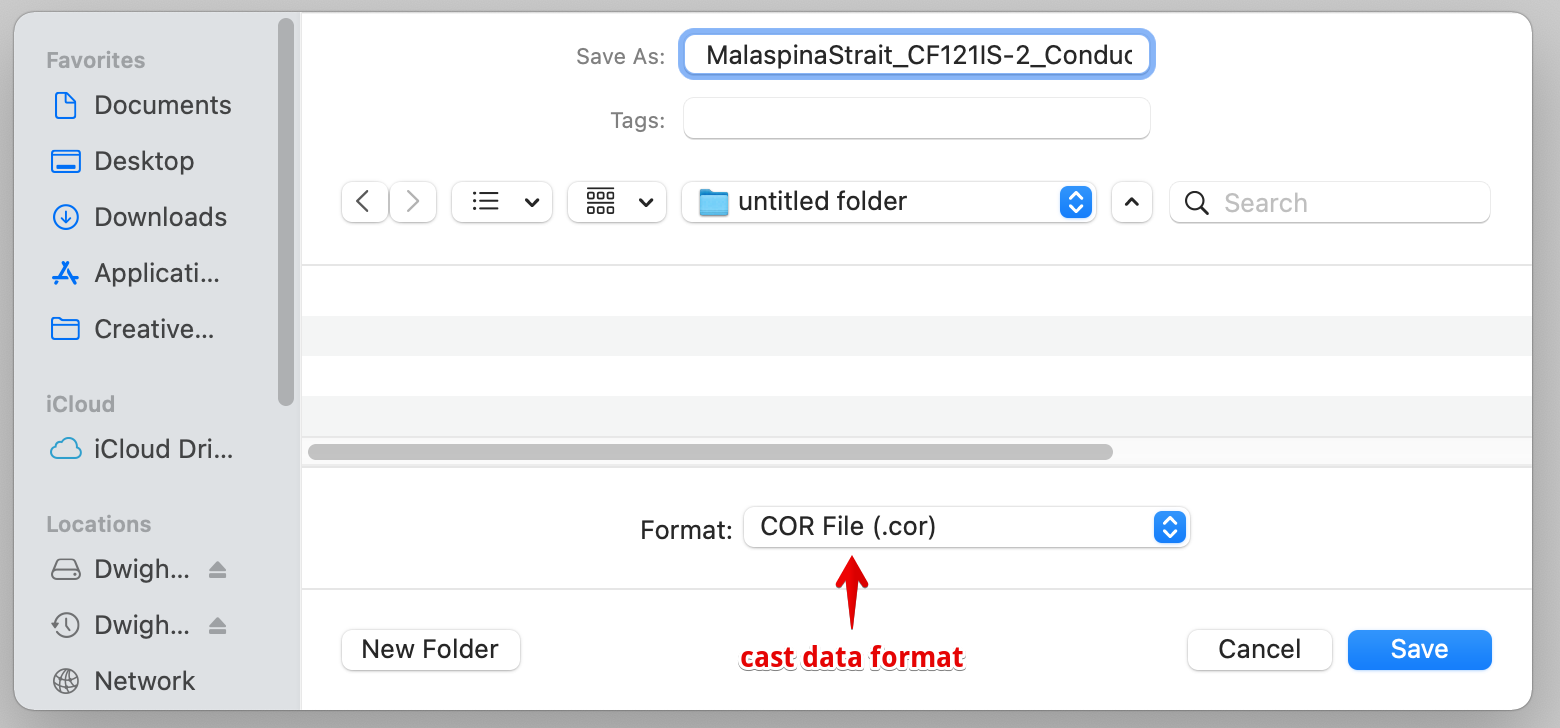
Clicking DOWNLOAD .COR allows you to save the data file to your computer. (click to enlarge)
Learn more about the Aligned and Depth-Binned Profile data file format.

The .COR format is a text file, which can be opened in a standard text editor.
About data layers

In addition to the Community Fishers data, Geospatial Map also provides access to EEW Heartbeat data from the Ocean Networks Canada's Earthquake Early Warning network. Display these different data sets via the layers icon. (click to enlarge)