Cast Scalar Profile Plot and Data
Device-level and sensor-level cast scalar profile data products are time or cast delimited scalar products for profile data. Cast-delimited options include up casts, down casts, stationary periods, step casts (VPS only), and all casts (up, down, and stationary). Individual casts are grouped daily for plotting purposes only. The cast options, plots and file products are available on cabled profilers (Vertical Profiler System (VPS) in Barkley Canyon and the Buoy Profiler System (BPS) in Saanich Inlet). For other casting / profiling deployments such as from ships or through the ice, only plots are available with the daily option (breaks at midnight PST or 0800 UTC), an example of this case are the Pacific Salmon Foundation (PSF) profiling CTDs, Oxygen Sensors and Fluorometers. This data is acquired in partnership with PSF for their Salish Sea Marine Survival program where community based fishers go out regularly to collect CTD casts at various locations. Here is an example in Data Search: https://data.oceannetworks.ca/DataSearch?location=SSMSP
Please note, the plotting products here are distinct from the Time Series Scalar Profile Plot, as they does not have a time axis. Both sets of plots aim to visualize vertical profile data.
Please consult individual instruments' documentation for more information.
Oceans 2.0 API filter: dataProductCode=CSPP
Revision History
- 20160901: Initial Release
- 20180507: Updated with cast delineation, options for cast type selection and temperature/conductivity lag correction
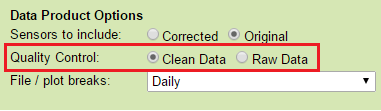
Data Product Options
Quality Control

Raw Data
When this option is selected, raw data will be supplied in the data products: no action is taken to modify the data. In general, all scalar data is associated with a quality control flag. These flags are stored adjacent to the data values.
Oceans 3.0 API filter: dpo_qualityControl=0
Clean Data
Selecting this option will cause any data values with quality control failures (QAQC flags 3, 4 and 6) to be replaced with NaNs. “-clean” is added at the end of the filename.
Oceans 3.0 API filter: dpo_qualityControl=0
Pre-processed clean corrected data (uses raw QAQC filter as pass through only) (Only available on corrected profilers and on corrected sensors only)
There is no quality control option when corrected is chosen for the sensors to include option. The corrected data has already processed and cleaned, so the raw QAQC option is used as a pass-through. Contact us for more information on the processing done to clean and correct cast data from mobile deployments.
Oceans 3.0 API filter: dpo_qualityControl=0
Sensors to Include (Device-level Only)

Corrected
A corrected version of the original sensor data that has been re-calculated to factor in variables such as falling speed to improve accuracy. “-Corrected” is added at the end of the filename. Sensors without "Corrected" in their names are excluded from the device-level data products.
Oceans 3.0 API filter: dpo_sensorstoinclude=1
Original
The original sensor data, excludes all sensors with "Corrected" in their name.
Oceans 3.0 API filter: sensorstoinclude=0
File / Plot Break
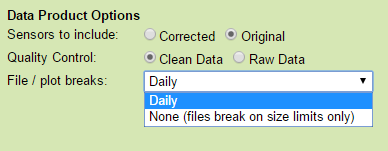
Daily
The time range specified will be broken up daily and a plot will be produced for each day. The break time is not strictly midnight, it is 0800 UTC (midnight PST, 0100 PDT).
Oceans 3.0 API filter: dpo_fileplotbreaks=1
None (files break on size limits only)
The time range specified will only be broken up if it exceeds the file size limit (1 GB when loaded into matlab: 400 to 600 MB MAT file).
Oceans 3.0 API filter: dpo_fileplotbreaks=0
Cast Delineation / Breaks:

Up casts only
Only data collected while the profiler is ascending the water column are selected. Individual up casts are identified and stored separately within one final data structure for file data products. A plot be produced for each day consisting of all up casts that began during that day. The break time is not strictly midnight, it is 0800 UTC (midnight PST, 0100 PDT).
Oceans 3.0 API filter: dpo_cast=up_casts
Down casts only
Only data collected while the profiler is descending the water column are selected. Individual down casts are identified and stored separately within one final data structure. The time range specified will be broken up daily and a plot will be produced for each day consisting of all down casts that began during that day. The break time is not strictly midnight, it is 0800 UTC (midnight PST, 0100 PDT).
Oceans 3.0 API filter: dpo_cast=down_casts
Stepped casts only
Only data collected while the profiler is stepped mode are selected (currently unique to VPS). Individual stepped casts (all up casts and stationary segments during a stepped cast) are identified and stored separately within one final data structure. Individual plots will be produced for each stepped cast.
Oceans 3.0 API filter: dpo_cast=stepped_casts
All casts
Only data collected while the profiler is ascending, descending, or stationary in the water column are selected. Individual casts (up, down, stationary) are identified and stored separately within one final data structure. The time range specified will be broken up daily and a plot will be produced for each day consisting of casts (up, down, stationary) that began during that day. The break time is not strictly midnight, it is 0800 UTC (midnight PST, 0100 PDT).
Oceans 3.0 API filter: dpo_cast=all_casts
Daily
The time range specified will be broken up daily and a plot will be produced for each day. The break time is not strictly midnight, it is 0800 UTC (midnight PST, 0100 PDT). Note: this option isn't normally offered for file products.
Oceans 3.0 API filter: dpo_cast=daily
None (files break on size limits only)
The time range specified will only be broken up if it exceeds the memory size limit (1 GB when loaded into matlab: 400 to 600 MB in MAT file). Note: this option isn't normally offered for file products.
Oceans 3.0 API filter: dpo_cast_none
Mobile Position Sensor Integration Option
For time series scalar file data products on mobile deployments, including the standard Time Series Scalar Data products as well as Cast Scalar Profile Plot and Data and Time Series Scalar Profile Plot and Gridded Data. All scalar data products from mobile deployments have positioning data integrated into the their time series (where available/applicable) aside the target sensor or sensors (for device-level requests). Integration includes position (Latitude, Longitude, Depth) and orientation (Heading, Pitch, Roll).
This option will exclude orientation sensors from the mobile position integration in time series scalar file data products. The default option here can be many times faster as orientation data can have very high sample rates and be very slow to interpolate on to the target sensor time series (orientation data usually comes from optical gyroscopes on inertial navigation systems). Most scalar sensor measurements such as temperature, salinity and not sensitive to orientation and do not need orientation data. For directional / orientation sensitive data, such as current velocities, ONC standard practice is to correct that data to be relative to true North / horizontal, so orientation is redundant there as well. Orientation sensors are not excluded from any metadata, such as plot comments or the metadata structure in MAT file data products; this option only affects the integration of orientation data into the time series.
This data product option may appear on devices / deployments where orientation data is not available or applicable to the selected data product, for example, some time series scalar profile plots and drifter devices. In those cases, the option has no effect. All data products do document which options were applied in their file headers (as in this case) and/or in their file-names.

Depth / Latitude / Longitude sensors only (faster)
Oceans 3.0 API filter: dpo_includeOrientationSensors=0
All mobile position and orientation sensors (Depth / Latitude / Longitude / Heading / Pitch / Roll / etc. - slower)
Oceans 3.0 API filter: dpo_includeOrientationSensors=1
Quality Control
Raw Data
When this option is selected, raw data will be supplied in the data products: no action is taken to modify the data. In general, all scalar data is associated with a quality control flag. These flags are stored adjacent to the data values.
Oceans 3.0 API filter: dpo_qualityControl=0
Clean Data
Selecting this option will cause any data values with quality control failures (QAQC flags 3, 4 and 6) to be replaced with NaNs. “-clean” is added at the end of the filename.
Oceans 3.0 API filter: dpo_qualityControl=0
Pre-processed clean corrected data (uses raw QAQC filter as pass through only) (Only available on corrected profilers and on corrected sensors only)
There is no quality control option when corrected is chosen for the sensors to include option. The corrected data has already processed and cleaned, so the raw QAQC option is used as a pass-through. Contact us for more information on the processing done to clean and correct cast data from mobile deployments.
Oceans 3.0 API filter: dpo_qualityControl=0
Sensors to Include (Device-level Only)
Corrected
A corrected version of the original sensor data that has been re-calculated to factor in variables such as falling speed to improve accuracy. “-Corrected” is added at the end of the filename. Sensors without "Corrected" in their names are excluded from the device-level data products.
Oceans 3.0 API filter: dpo_sensorstoinclude=1
Original
The original sensor data, excludes all sensors with "Corrected" in their name.
Oceans 3.0 API filter: sensorstoinclude=0
File / Plot Break
Daily
The time range specified will be broken up daily and a plot will be produced for each day. The break time is not strictly midnight, it is 0800 UTC (midnight PST, 0100 PDT).
Oceans 3.0 API filter: dpo_fileplotbreaks=1
None (files break on size limits only)
The time range specified will only be broken up if it exceeds the file size limit (1 GB when loaded into matlab: 400 to 600 MB MAT file).
Oceans 3.0 API filter: dpo_fileplotbreaks=0
Cast Delineation / Breaks:
Up casts only
Only data collected while the profiler is ascending the water column are selected. Individual up casts are identified and stored separately within one final data structure for file data products. A plot be produced for each day consisting of all up casts that began during that day. The break time is not strictly midnight, it is 0800 UTC (midnight PST, 0100 PDT).
Oceans 3.0 API filter: dpo_cast=up_casts
Down casts only
Only data collected while the profiler is descending the water column are selected. Individual down casts are identified and stored separately within one final data structure. The time range specified will be broken up daily and a plot will be produced for each day consisting of all down casts that began during that day. The break time is not strictly midnight, it is 0800 UTC (midnight PST, 0100 PDT).
Oceans 3.0 API filter: dpo_cast=down_casts
Stepped casts only
Only data collected while the profiler is stepped mode are selected (currently unique to VPS). Individual stepped casts (all up casts and stationary segments during a stepped cast) are identified and stored separately within one final data structure. Individual plots will be produced for each stepped cast.
Oceans 3.0 API filter: dpo_cast=stepped_casts
All casts
Only data collected while the profiler is ascending, descending, or stationary in the water column are selected. Individual casts (up, down, stationary) are identified and stored separately within one final data structure. The time range specified will be broken up daily and a plot will be produced for each day consisting of casts (up, down, stationary) that began during that day. The break time is not strictly midnight, it is 0800 UTC (midnight PST, 0100 PDT).
Oceans 3.0 API filter: dpo_cast=all_casts
Daily
The time range specified will be broken up daily and a plot will be produced for each day. The break time is not strictly midnight, it is 0800 UTC (midnight PST, 0100 PDT). Note: this option isn't normally offered for file products.
Oceans 3.0 API filter: dpo_cast=daily
None (files break on size limits only)
The time range specified will only be broken up if it exceeds the memory size limit (1 GB when loaded into matlab: 400 to 600 MB in MAT file). Note: this option isn't normally offered for file products.
Oceans 3.0 API filter: dpo_cast_none
Mobile Position Sensor Integration Option
All scalar data products from mobile deployments have positioning data integrated into the their time series (where available/applicable) aside the target sensor or sensors (for device-level requests). Integration includes position (Latitude, Longitude, Depth) and orientation (Heading, Pitch, Roll).
This option will exclude orientation sensors from the mobile position integration in time series scalar file data products. The default option here can be many times faster as orientation data can have very high sample rates and be very slow to interpolate on to the target sensor time series (orientation data usually comes from optical gyroscopes on inertial navigation systems). Most scalar sensor measurements such as temperature, salinity and not sensitive to orientation and do not need orientation data. For directional / orientation sensitive data, such as current velocities, ONC standard practice is to correct that data to be relative to true North / horizontal, so orientation is redundant there as well. Orientation sensors are not excluded from any metadata, such as plot comments or the metadata structure in MAT file data products; this option only affects the integration of orientation data into the time series.
This data product option may appear on devices / deployments where orientation data is not available or applicable to the selected data product, for example, some time series scalar profile plots and drifter devices. In those cases, the option has no effect. All data products do document which options were applied in their file headers (as in this case) and/or in their file-names.
Depth / Latitude / Longitude sensors only (faster)
Oceans 3.0 API filter: dpo_includeOrientationSensors=0
All mobile position and orientation sensors (Depth / Latitude / Longitude / Heading / Pitch / Roll / etc. - slower)
Oceans 3.0 API filter: dpo_includeOrientationSensors=1
Formats
MAT / netCDF: Cast Scalar Profile Data
This data is available as MAT or netCDF data products. The MAT file is structured as an MxN structure where M is the cast field including sensor data (cond, temp, psal, etc.) and cast details (cast start date, end data, duration, depth, direction, etc.), and N is the cast number. Sensor data is stored in a structure identical to its original data structure (sensorID, samplePeriod, time, data, qaqcflags, etc.).
PNG / PDF: Cast Scalar Profile Plot
This data is available as PNG or PDF format plots.
Cast Scalar Profile plots are plots of depth versus the variable or sensor being plotted. These are the standard CTD cast-type plots. Multiple sensors maybe plotted on multiple x-axes for device-level plots.
For device level plots, particularly for CTDs, we put density, sigma-t, and conductivity vs depth in the first plot, with specific colours while the remaining sensors are plotted in subsequent plots. The second plot contains practical salinity, temperature, sigma-theta, and sound speed vs depth. Each plot is colour coded to improve readability. The second plot will have “_2” added on the end of the filename. Here is an example of a device level plot search for down casts on the BPS, resulting in two plots:


Here is an example of single sensor plot for up casts on the VPS:

Oceans 2.0 API filter: extension={png,pdf}
Temperature/Conductivity Lag Correction
A temporal lag between temperature and conductivity sensors can arise from the difference in physical location, response time, and flow rate of the sensors. Another source of T-C lag is due to heat stored in the conductivity sensor material. If users choose this product or Time Series Scalar Profile Plot and Gridded Data and request data that includes temperature and conductivity sensors, they will receive estimated T-C correction terms. These values are used to calculate newly aligned sensors designated with ‘_aligned’ after the sensors name.
T-C lag values are calculated using an FFT process originally written by Jody Klymak. T-C profiles undergo spectral analysis and cases where coherence > 90% are used to calculate a lag correction term that is applied to the temperature sensor, and subsequently applied to the derived sensors (salinity, density, sigma-t, sigma-theta, and sound speed) by re-calculating them with the newly aligned temperature data. These lag correction terms are stored in the data structure under the field ‘TClag’. The TClag values are smoothed over 6 casts. If there are less than 6 values to average over, the user will get a warning that ‘TClag determined from small sample size’. Lack of any TClag values will result in NaN.
The newly calculated ‘_aligned’ sensors do not have unique sensor ID’s. Therefore, they cannot be explicitly searched for in Oceans 2.0 and will not show up in Cast Scalar Profile plots. They will however show up in Time Series Scalar Profile plots and both MAT or netCDF data files, but only if the user selects data that includes both temperature and conductivity sensors.
Discussion
To comment on this product, click Write a comment below.