What is it?
Data Preview gives you at-a-glance updates of data from the previous day and week. It allows you easy access to recent Oceans 2.0 data.
1.. | |
| 2. Click on a region, and display a summary of locations. | |
3. Click to view Sites at each location. A site is where instruments are deployed, either on a platform, an autonomous buoy, or a mobile platform such as a ferry, Autonomous Underwater Vehicle (AUV) or or Remotely-Operated Vehicle (ROV).
| |
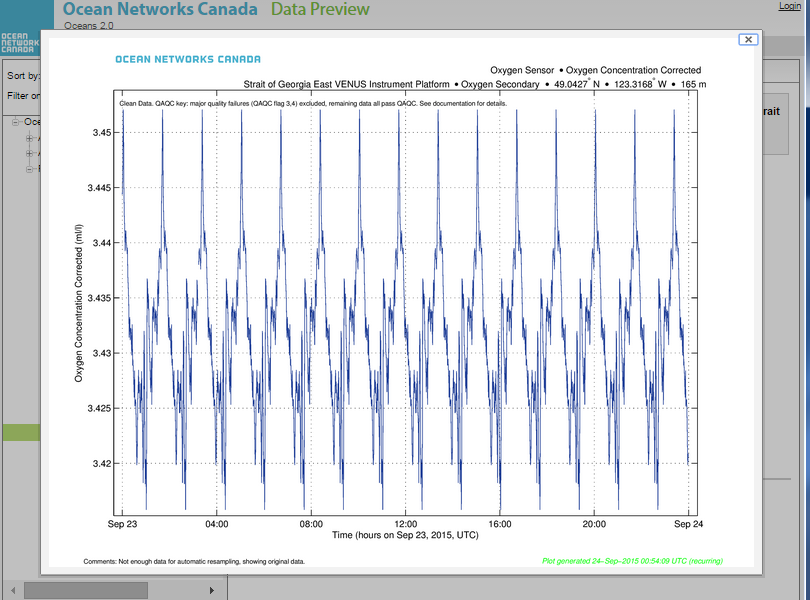
| 4. Some sites include a 'state of the ocean' plot, representing a summary of ocean data at that site over time. |


SCREENSHOT-DataPreview-Landing-w Map
* page navigation across top (tabs highlight)
* navigation tree (observatory > location > Device Category)
* "Sort By" drop-down: default is Instruments by Location
* "Filter on": default is none; options are to filter by a single Device category
SCREENSHOT-DataPreview_Sort-FilterANIM
SCREENSHOT-DataPreview-HilightPacific-treeOpen
Result panel (on right side)
* Click on Geographic area, summaries of areas, ROV data and mobile assets (such as Ferry or Pacific Salmon Foundation)
NEED_SCREENSHOT
*

Why is this useful?
Data Preview was pioneered by the VENUS team to make it simple for anyone to access recent data. Data Preview is a simple, uncomplicated way to explore ocean data. Data Search and Plotting Utility tools have advanced features for ocean researchers, but take some training to use.
Register an Oceans 2.0 account & get more features
Personal history - remember searches, save plots, create annotations.
Share: send plots to colleagues and friends.
Community: join research working groups, share ideas for experiments and data analysis.
")
The navigation tree is highlighted in green, and in the content pane is a summary of the regional observatories


The selected sensor will display as a plot in the right pane. You can choose between last day and last month of data.
")
The navigation tree is highlighted in green, and in the content pane is a summary of the regional observatories
When you first access Oceans 2.0, you will be in Data Preview
The opening screen gives an overview of the Ocean Networks Canada observatories, the type of data collected to support ocean research and a variety of other science disciplines.

Click on the navigation tree on the left. It displays the top-level observatories on the Pacific, Arctic, and Atlantic.