What is it?
Data Preview gives you at-a-glance updates of data from the previous day and month. It allows you easy access to recent Oceans 3.0 data.
Why is this useful?
Data Preview was pioneered by the VENUS team to make it simple for anyone to access recent data. Data Preview is a simple, uncomplicated way to explore ocean data. Data Search and Plotting Utility tools have advanced features for ocean researchers, but take some training to use.
Register an Oceans 3.0 account & get more features
Personal history - remember searches, save plots, create annotations.
Share: send plots to colleagues and friends.
Community: join research working groups, share ideas for experiments and data analysis.
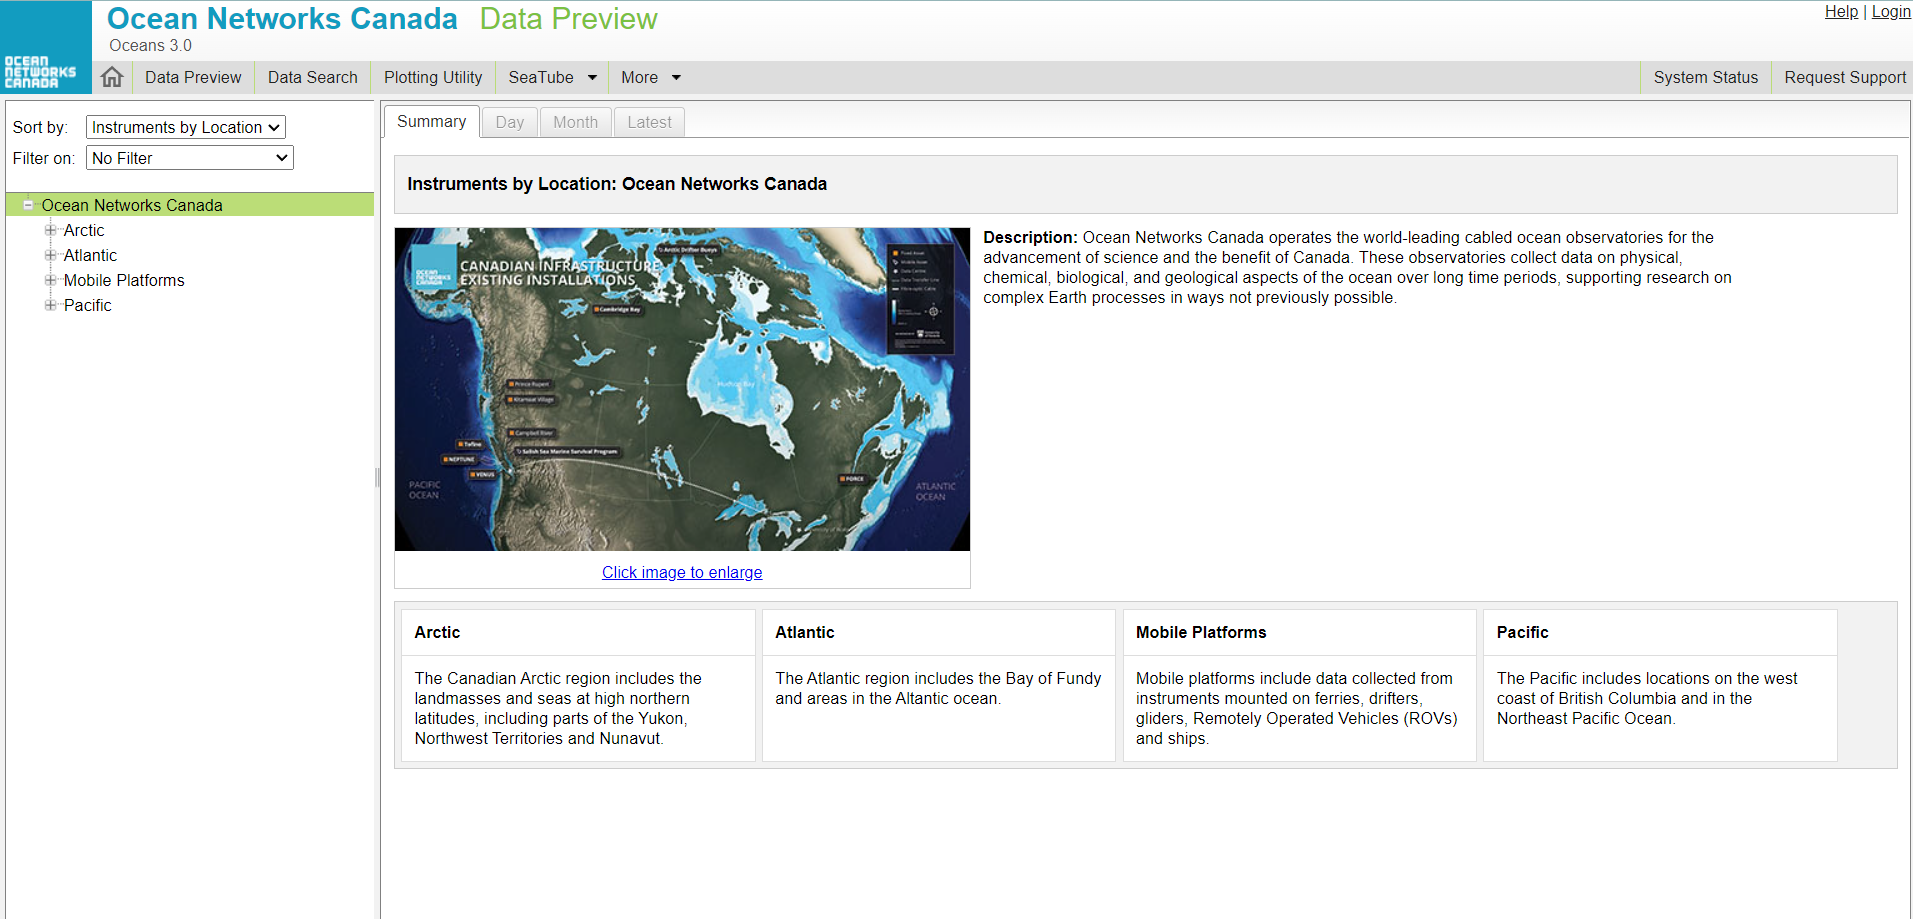
The navigation tree is highlighted in green, and in the content pane is a summary of the regional observatories. (click to enlarge)

Click on an Observatory, and a list of locations is displayed. Scroll down to view all listings.
Please note that the search tree is trimmed to show only recent data. Anything that does not have data within a month will not appear.
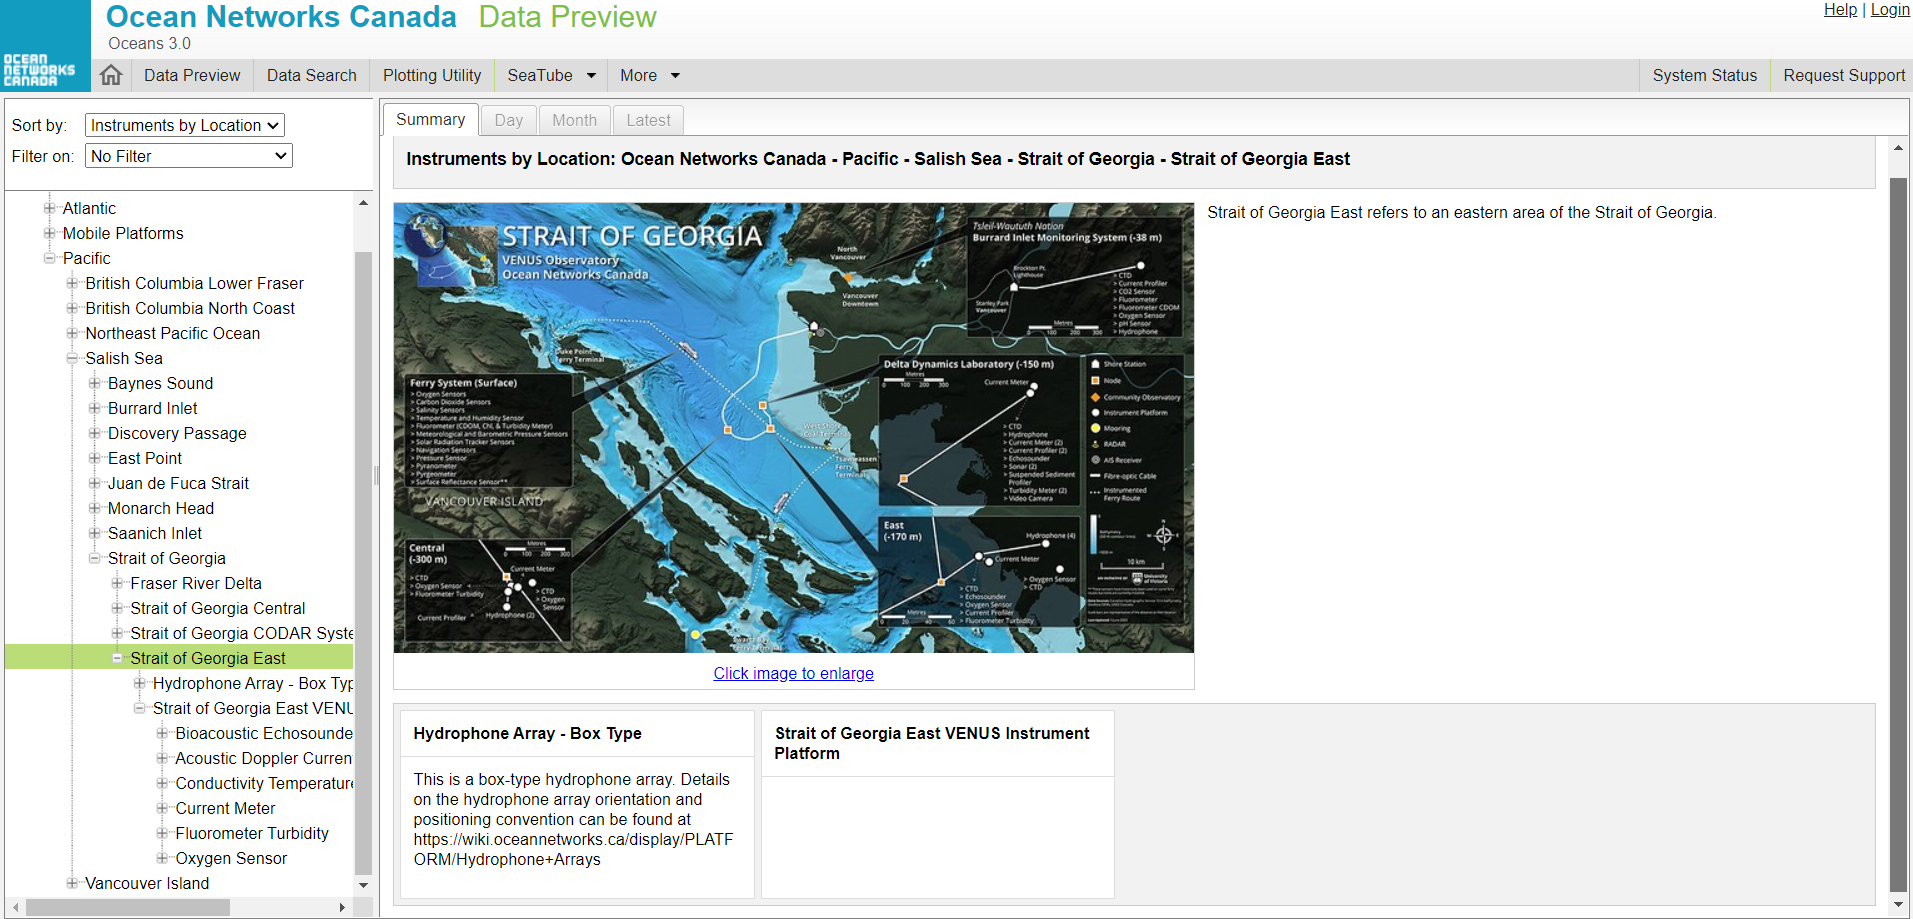
Click to view Sites at each location. A site is where instruments are deployed – on a platform, an autonomous buoy, or a mobile platform.

Click on an instrument to display a plot of the previous day in the content area. The tabs at the top let you select between daily and monthly plots.

Click on the plot to zoom in, and click anywhere outside the plot to restore the screen.
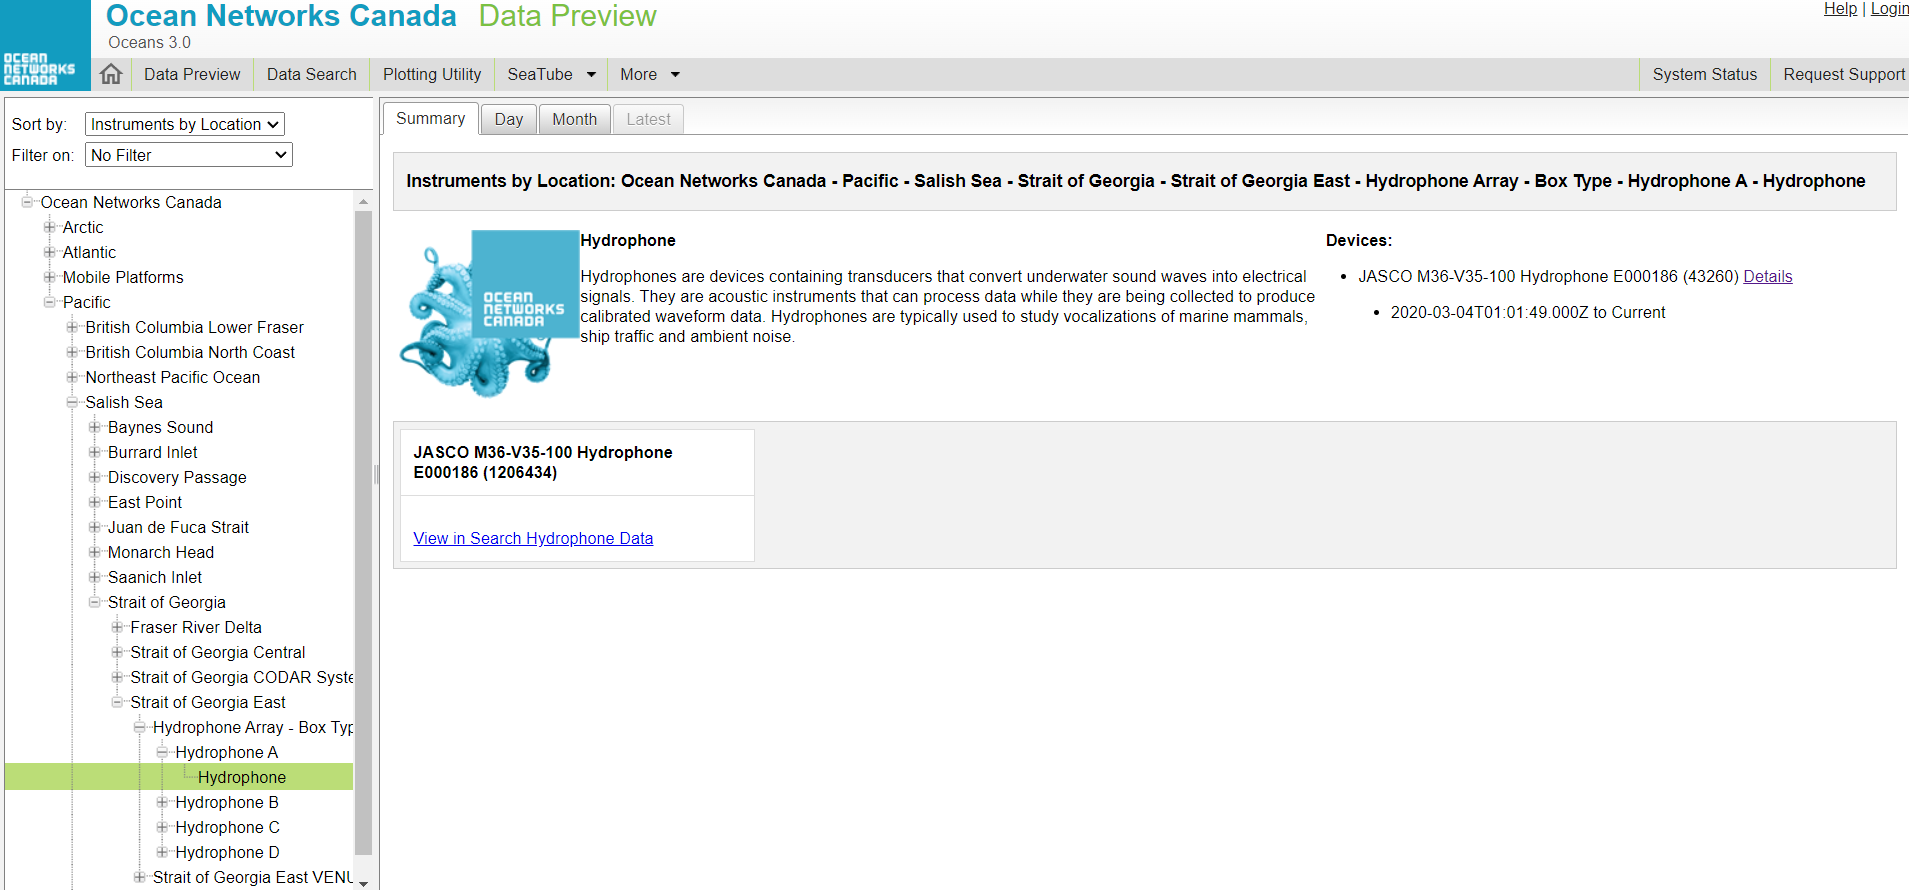
Certain instruments, such as Hydrophones, require a different application to view. Click on "View in Search Hydrophone Data" to launch the application.