This data may be diverted or delayed for security reasons. Read on below for more information. |
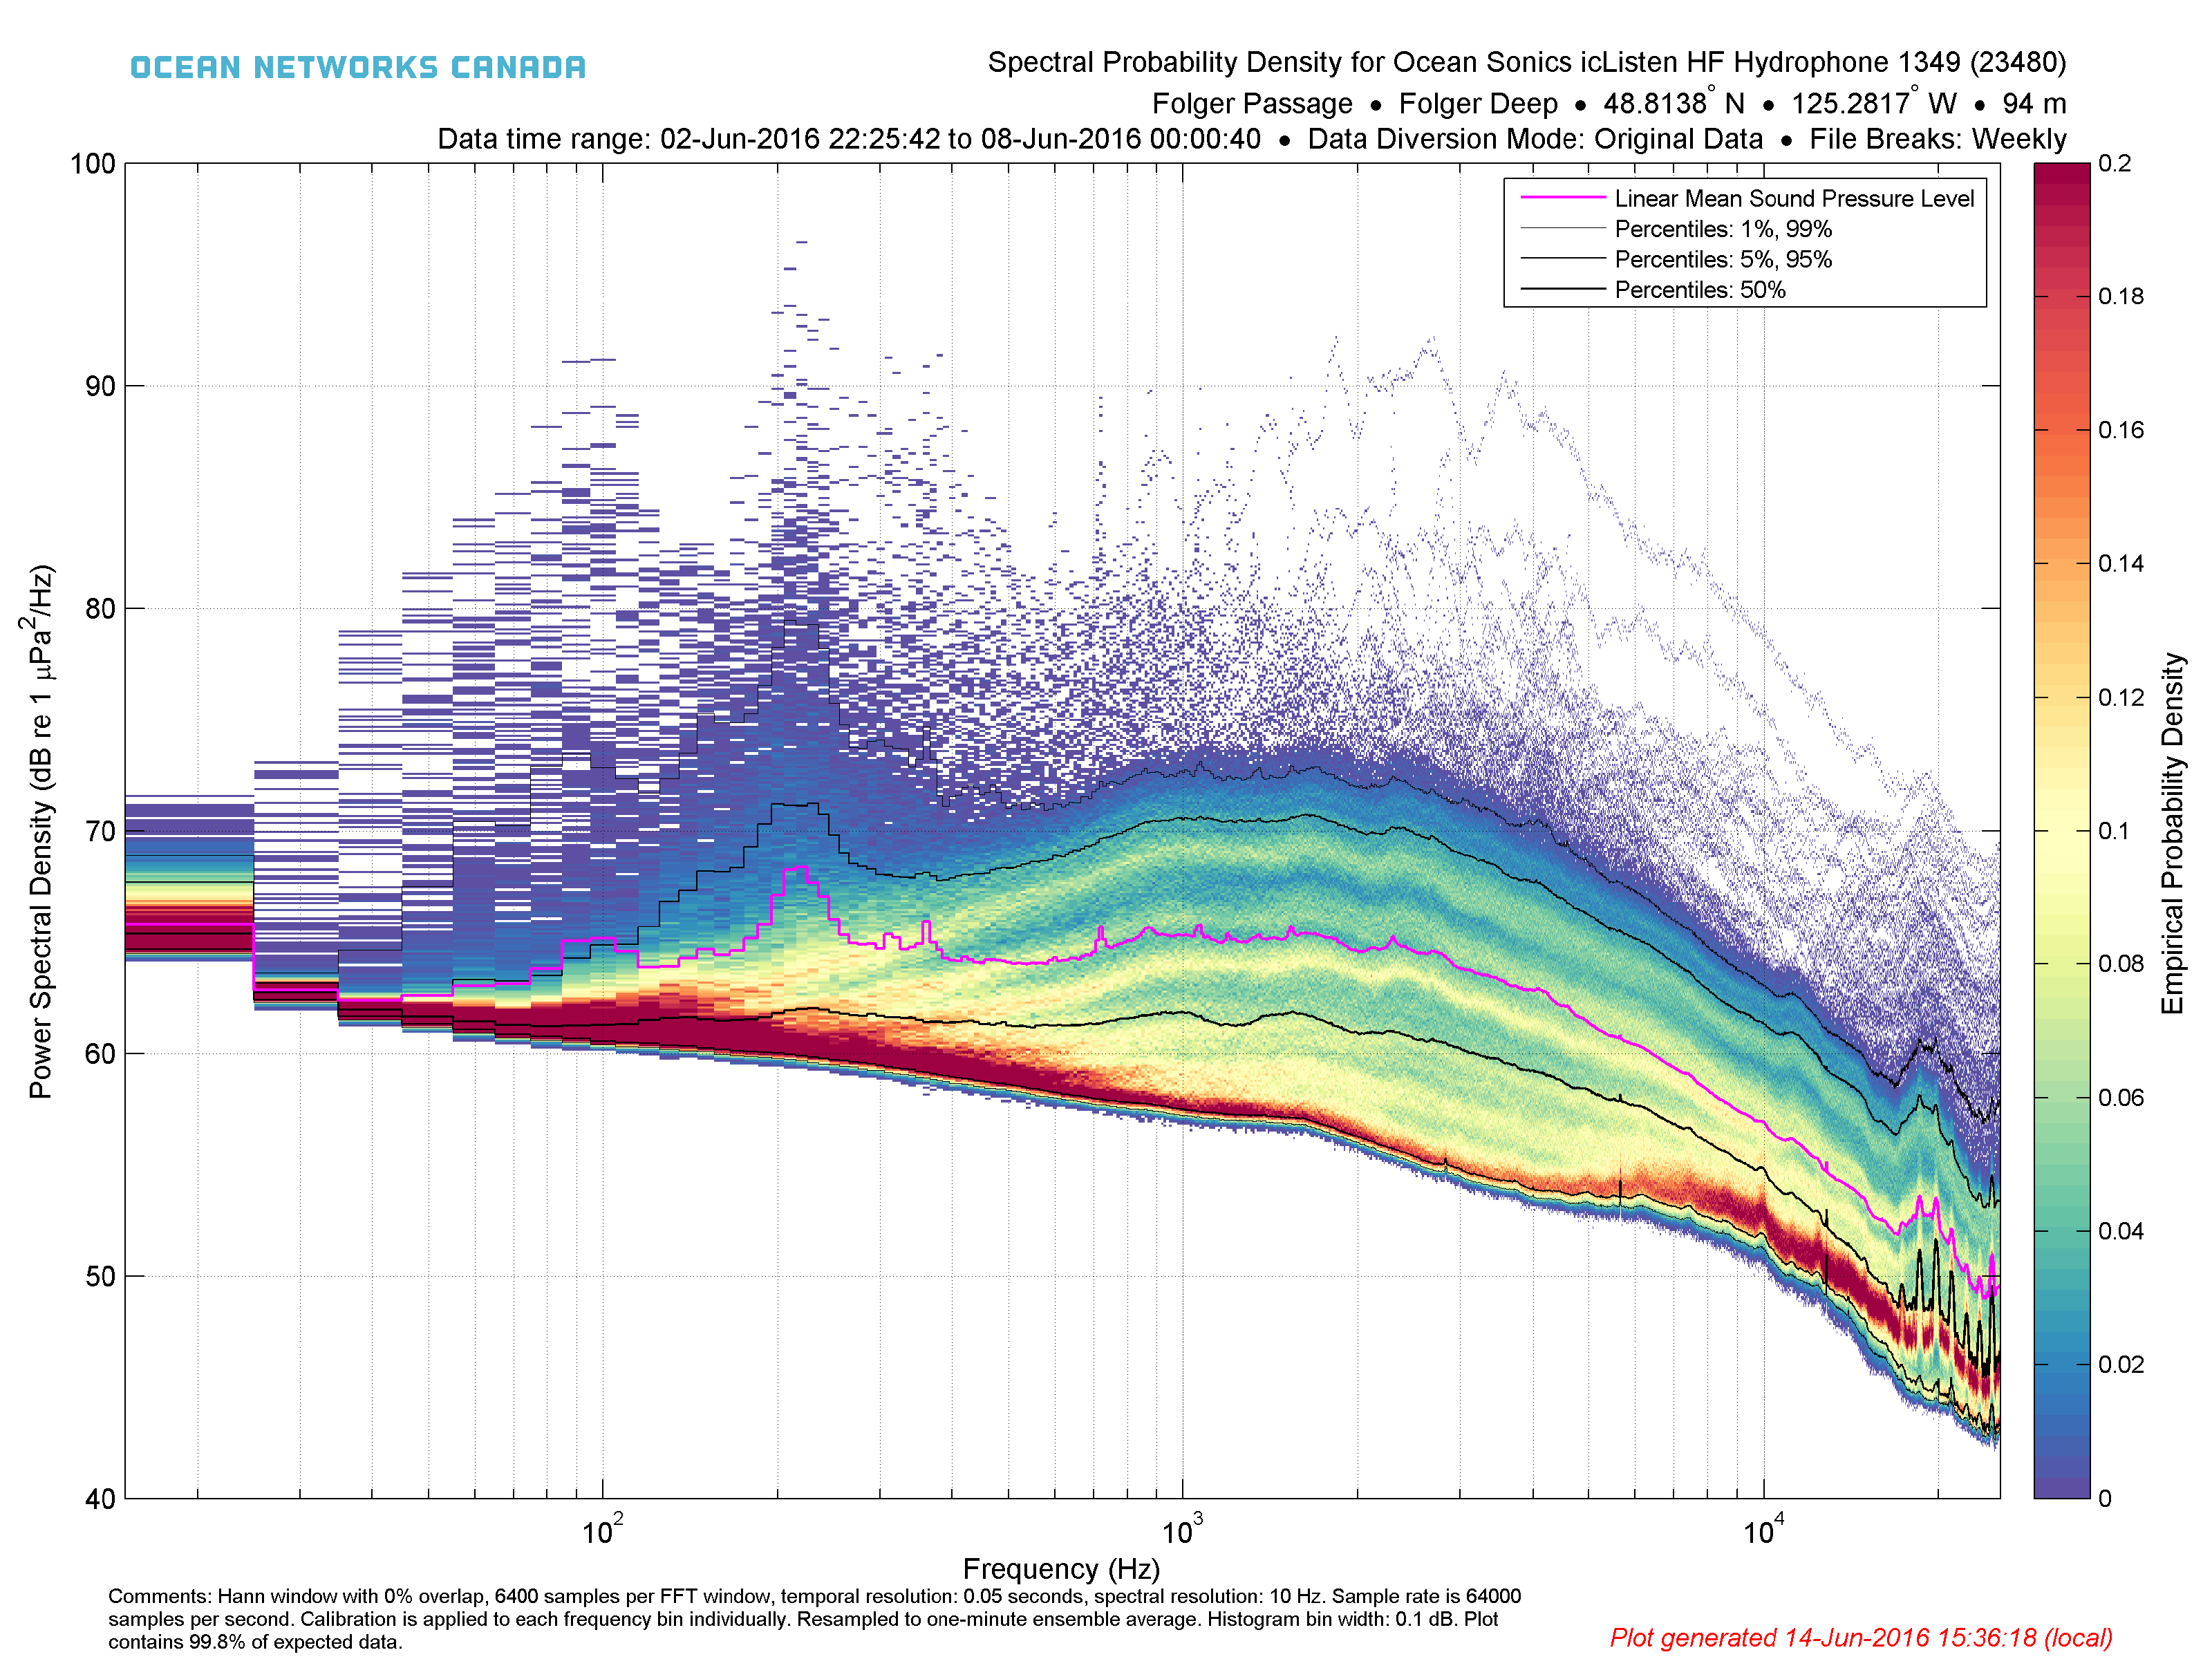
Spectral Probability Density (SPD) plots are useful for assessing the quality and performance of hydrophone audio data, as well as looking for signals such as marine mammals, ships etc. The plot was first described by Merchant et. al. (2013), see reference here. The plots are a 3D histogram with audio frequency on a logarithmic scale on the horizontal axis and power spectral density on the vertical axis. The body of the plot is then a heat map of the relative number of data points occurring at each intersection of frequency and power spectral density; this is labelled as the "Empirical Spectral Probability Density", the units of which are relative and a function of the horizontal and vertical bin sizes (and the relative occurrence of the data). By default, a weeks' worth of data is plotted per plot, although daily and no break options are available. This provides a summary of up to 2016 individual five minute spectrograms. The calculation and calibration of the spectral data is the same as the spectrograms, see Hydrophone Spectral Data for more information. The distribution of the data is used to investigate the nominal frequency response of the hydrophone, including background noise, while outlier data points could be interesting transient signals such as whale, ships, etc. The data limits and bin sizes are determined so that they are consistent from plot to plot for ease of comparison. Line plots are overlain to indicate the 1, 5, 50, 95, 99th percentiles in the distribution for each frequency bin, plus the linear mean sound pressure level (known as SPLlin in Merchant's paper, also note that lines are not available if there's less than 6 hours of data). Information on the processing done, calibration and data availability is noted below the plot, while the data product options are indicated in the title above the plot, along with the usual information on location and device (the data time range maybe dropped from the title if it gets too long, it's redundant with the filename). See the example below:

A weeks' worth of data accumulates 2016 wav/hyd source files and summarizing upwards of 70GB of data. If the user's request starts or ends part way through a week or is less then a week total, then, accordingly, less data is plotted, and the 'Weekly' wording in the title is dropped (as in the above example). A week is defined as starting Sunday at midnight. For example, if a user searches Saturday the 1st to Monday the 8th, then three plots will be produced. The same logic applies to the daily plot, with file breaks at midnight.
The data is subject to diversion and filtering by the military, as described here. A "divert" period lasts a few hours to a few days and the subsequent review and return of that data may take up to 3 months (usually less than a month). Diversion affects data availability and any returned data is immediately processed and integrated into the system automatically. Data may be returned in full or in low-pass filtered (LPF) and/or high-pass filtered (HPF) segments. LPF/HPF data is normally fairly obvious in the SPD plots as there will be a dramatic cut-off at either the high or low end of the frequencies and the filtered data that is shown will all appear at less than 40 dB. Data product options alter the results as well, see the data product options described below. If a diversion returns 'LPF' or 'HPF' filtered data and the user selects the 'All' data product option, and if the spectral frequencies available do not change, then LPF/HPF and original spectral data maybe combined in the same plot, where one would see the normal (as above) and some data at a much lower PSD. If LPF/HPF or any data has a different number of spectral frequencies, then the plots will break and won't be combined.
Most hydrophones are calibrated as described on the spectral data product page. If calibrated, the vertical axis limits are dB re 1 μPa2 Hz-1, if not calibrated the units are dB re full scale Hz-1. A comment on the calibration will also appear.
Data availability may be limited for low-bandwidth deployments (Cambridge Bay). This data product is produced from hydrophone spectral MAT files, which are pre-processed and stored for fast retrieval. Spectral probability density plots are quick to generate if all the MAT files are pre-processed (~1 minute per week), if not, the spectral data has to be generated on the fly, which could take as long 1/2 day per one week plot. For advanced users, the data that forms the plots, the spectral probability density histogram, the percentiles and linear mean sound pressure level are also available in a MAT file product; please note that this MAT file product is distinct from hydrophone spectral MAT files.
Oceans 3.0 API filter: dataProductCode=HSPD
Hydrophone spectral probability density data products are available in PNG, PDF format for plots, and a MAT file product containing the data used in the plots: the spectral probability density histogram, percentiles and linear mean sound pressure level.
Oceans 3.0 API filter: extension={png,pdf,mat}
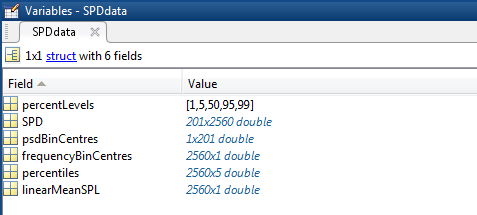
The MAT file format contains the data used to create the SPD plots: a structure named SPDdata containing the spectral probability density histogram, percentiles and linear mean sound pressure level, as well as the usual Meta data structure:
SPDdata: structure containing hydrophone spectral data in the following fields:

To comment on this product, log in and click Write a comment... below.