Register for an Oceans 2.0 account & get more features
- You can view public dashboards without logging in, but you need an account to create, customize and share your own.
What are they?
Dashboards are a way to view a collection of data on a single web page. There are two types:
| Public Dashboards | Private Dashboards |
|---|---|
|
|
What's included?
Dashboards can include the following types of data "widgets":
- hydrophone audio clips
- pre-generated plots
- images from anywhere on the Web
- interactive plots
- numerical instrument readings
- text
- video clips from ONC's shore-based and underwater cameras
Why are these useful?
Dashboards are a 1-stop place to see collections of related information and data. This makes the latest data and recordings available at a single click. They are a great way to keep tabs on an underwater location of interest or get a snapshot of latest readings from an experiment.
How to use Dashboards
Step 1: Browse Existing Dashboards
When you visit https://data.oceannetworks.ca/Dashboards, a list shows all available dashboards. This includes Public Dashboards and, if you are logged in, your Private Dashboards.
Choose a dashboard from the list.
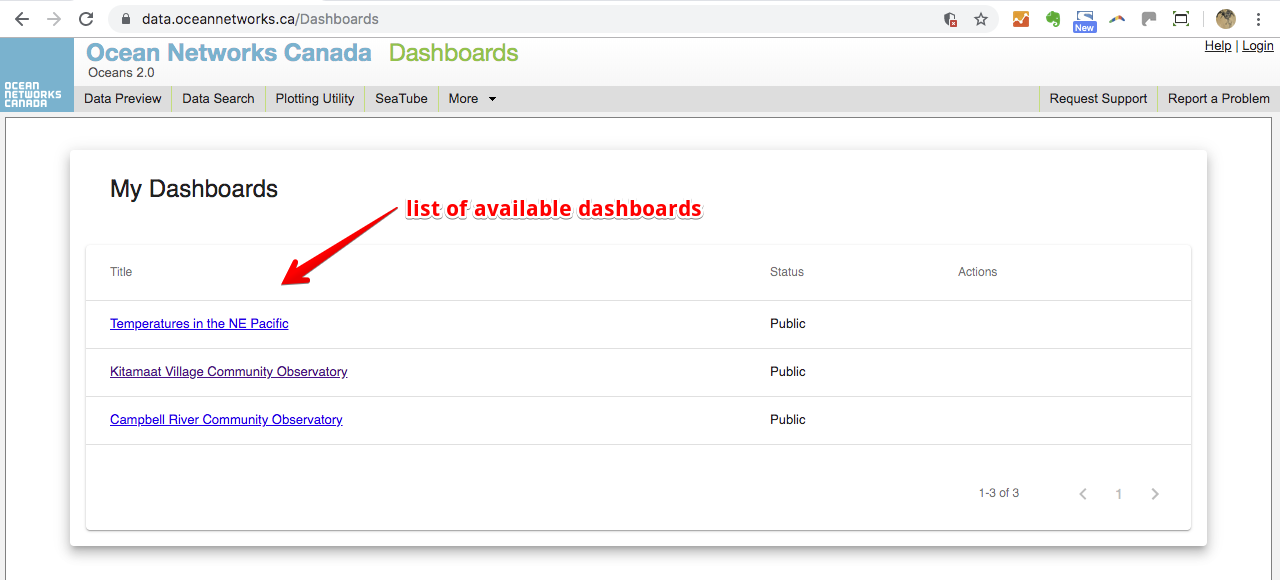
(click to enlarge)
Step 2: View a Dashboard
When you open a dashboard, you can view the various data displays called "widgets". Example: Kitamaat Village Community Observatory Dashboard.
Click play buttons on videos and audio clips to start playback, click column headers to sort listed items.
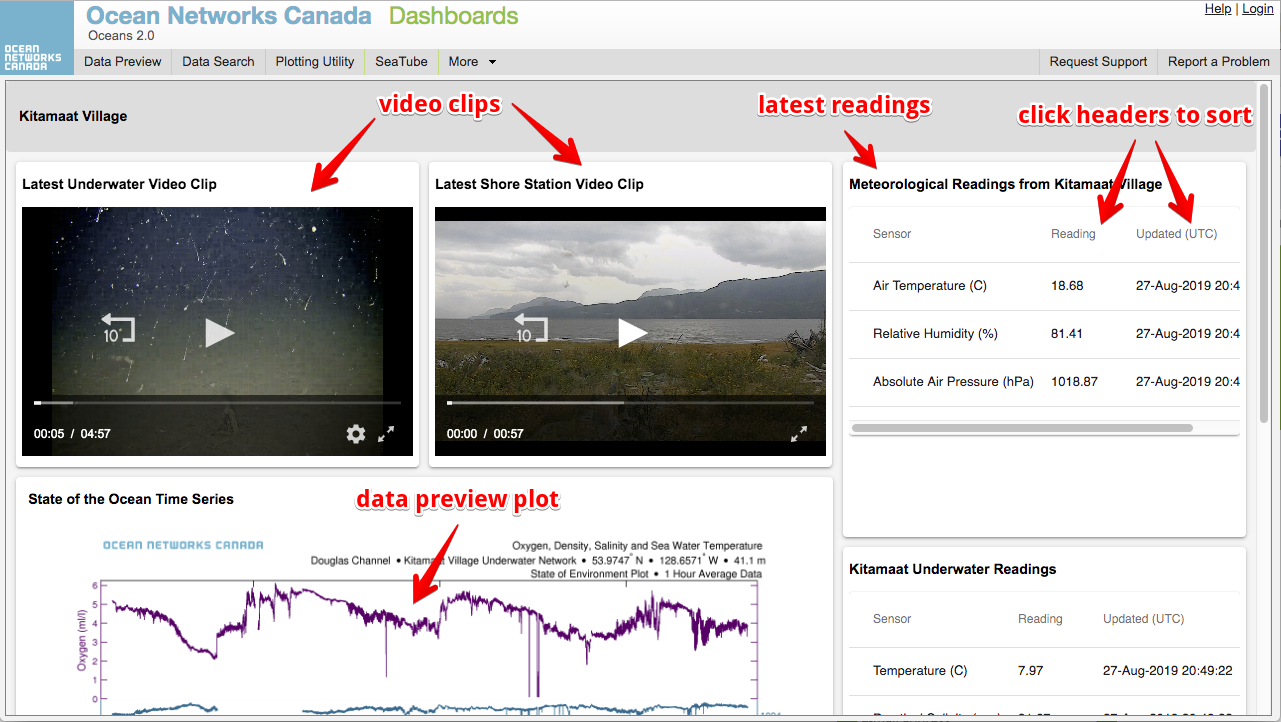
(click to enlarge)
Step 3: Create your own Dashboard.
If you have an Oceans 2.0 account and are logged in, you can create a dashboard.
Click Add Dashboard to start.

(click to enlarge)
Step 4: Share your Dashboard.
From https://data.oceannetworks.ca/Dashboards, click Make Public under the 3-dot menu. You can only do this for dashboards you have created. Once Public, you can choose Make Private to hide your dashboard.
(click to enlarge)