AGO Heat Probe Time Series Plot
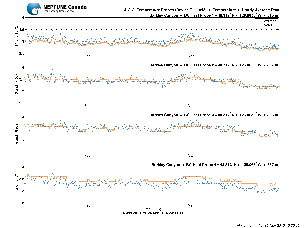
A specialized plot to compare time series of all the AGO Heat Probe sensors is available. There are probes for each of the four sites where pairs of sediment and water probes were co-located. Curves are colour-coded, such that probes in the sediment are beige and probes in the water are blue. Basic metadata information is also included. This data product is a variation on normal time series scalar plots.
Oceans 2.0 API filter: dataProductCode=AGOTSP
Revision History
- 20100721: Data product initially released
Parameters
Unable to render {include} The included page could not be found.
Formats
Plots are available in PNG and PDF format.
Oceans 2.0 API filter: extension={png,pdf}
PNG Example:
Discussion
To comment on this product, click Add Comment below.