What is it?
Data Search provides a robust set of features researchers with robust data processing and visualization for both scalar and complex data products. Results are publishable products with accompanying metadata reports for citation can be published in scientific papers. Many more instrument types are searchable than in Data Preview, including hydrophones, seismometers, vertical profilers, ship data and cameras.
Using a shopping cart model, you can create & download multiple searches at your convenience. If you log in with an Oceans 2.0 account, your previous data searches are retained.
Why is this useful?
Searching large massive data sets over time can generate massive amounts of huge data downloads. Data Search gives you options such as averaging, Min/Max and selecting Clean or Raw data to control the amount of data you wish to process for downloading.
A search history lets you start a search while at one location (e.g., work) and then check in on that search from somewhere else (e.g., you mobile device, or at home)
Register an Oceans 2.0 account & get more features
Personal history - remember searches, save plots, create annotations.
Share: send plots to colleagues and friends.
Community: join research working groups, share ideas for experiments and data analysis.
and more (click for details)
| Panel | ||||||||||||
|---|---|---|---|---|---|---|---|---|---|---|---|---|
| ||||||||||||
The navigation tree is highlighted in green, and in the content pane is a summary of the regional observatories. (click to enlarge) |
| Panel | ||||||||||||||
|---|---|---|---|---|---|---|---|---|---|---|---|---|---|---|
| ||||||||||||||
Select 'Filter On:' from the navigation tree to chose an instrument category. |

| Panel | ||||||||||||
|---|---|---|---|---|---|---|---|---|---|---|---|---|
| ||||||||||||
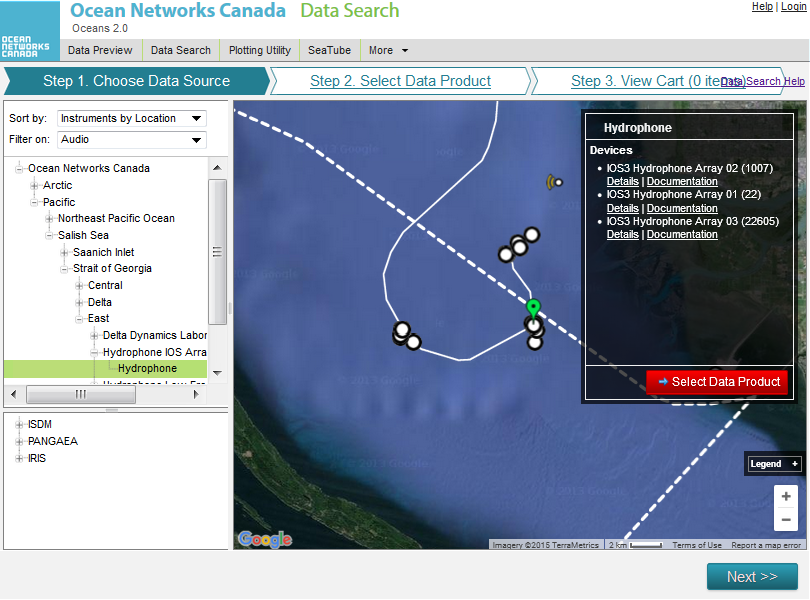
In this example, Audio filters for instruments that collect audio data. The tree now displays results of this type. When you select a location, it highlights in green and details are displayed on the info box on the right of the map. |
| Panel | ||||||||||||
|---|---|---|---|---|---|---|---|---|---|---|---|---|
| ||||||||||||
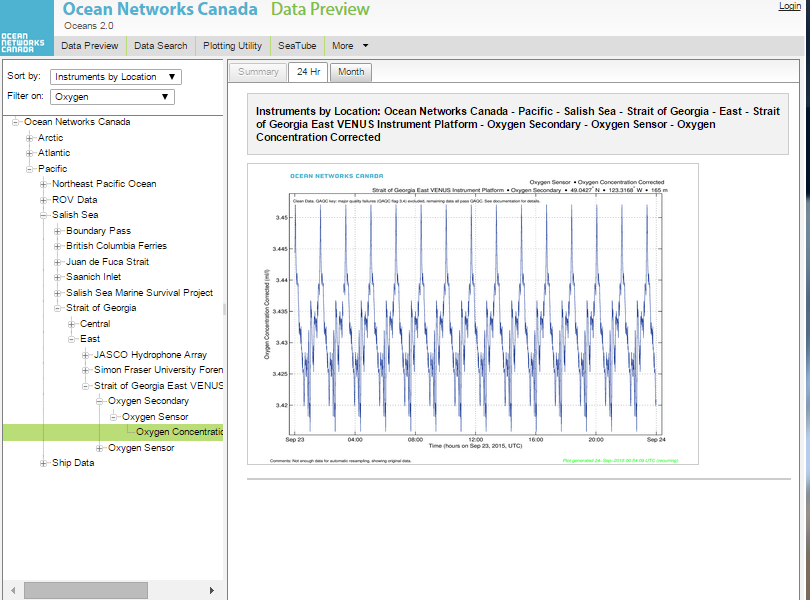
Click on an instrument to display a plot of the previous day in the content area. The tabs at the top let you select between daily and monthly plots. |
| Panel | ||||||||||||
|---|---|---|---|---|---|---|---|---|---|---|---|---|
| ||||||||||||
Click on the plot to zoom in, and click anywhere outside the plot to restore the screen. |

| Panel | ||||||||||||
|---|---|---|---|---|---|---|---|---|---|---|---|---|
| ||||||||||||
Certain instruments, such as Hydrophones, require a different application to view. Click on "Search Hydrophone Data" to launch the application. |
