Cast Scalar Multi-Profile Plot
This data product is used for displaying profile data in a community orientated format. A profile is a series of measurements made throughout the water column grouped by each pass through the water, known as a 'cast', as opposed to continuous time series data. Profiles of the water column can be created by performing casts with instruments. Casts involve lowering an instrument down into the water and back up again while it is making measurements. Cast detection or delineation is performed automatically with manual oversight, contact us for further details. The measurements from the various sensors attached to and within the instrument are processed to filter, smooth, align, and average data into depth bins. Information about the data processing applied is included in the comment of the data product. Specifically, the default processing steps are:
- The alignment of oxygen to account for instrument response lags. This is instrument dependent.
- Chlorophyll is filtered using a 25 median point filter.
- Temperature and conductivity data is smoothed using a 5 point running mean.
- Practical salinity, sound speed, and density are calculated using smoothed temperature, smoothed conductivity, and pressure.
- Data is averaged into 1 m bins centred at 1 m intervals. Data is only averaged into its corresponding bin if 70% of the data within the bounds of the bin has a QAQC flag of 1.
The descending portion of the cast is then extracted (this will be user configuration in the future, as well as cast detection, alignment, binning parameters). This data product is only used with aligned and depth binned data and extracted down casts. Also, this data product includes data from sensors that are connected to the parent device. The naming convention for these plots informs what data has been included in that particular plot; the different types of data are delineated by two '_'. At the end of the filename are the start and end dates of the cast which is separated by one '_'. An example of the filename when the plot is created through datasearch can be seen below. These plots are also available through the geospatial map for community fishers, when these plots are downloaded from the geospatial map the filename has -large appended to the file name, there is also an example of these file formats below.
- SalishSeaMarineSurvivalProject_Irvines_Sechelt_temperature__practicalSalinity__chlorophyll__oxygenSaturation__20180510T214842Z_20180510T215129Z.png
- SalishSeaMarineSurvivalProject_Irvines_Sechelt_temperature__practicalSalinity__chlorophyll__oxygenSaturation__20180607T222420Z_20180607T222608Z-large.png
This data product is very similar to the Cast Profile plots, documented here: 56. The major difference is that each profile within the image is for one cast and one sensor. This data product is currently constrained to aligned and depth binned sensors on Community Fishers casting devices (CTD, oxygen sensor, fluorometer), and will only display the four major ocean properties: Temperature, Practical Salinity, Chlorophyll and Oxygen Saturation. An example of a Cast Scalar Multi-ProfilePlot can be seen below as figure 1.
Oceans 3.0 API filter: dataProductCode=CSMPP

Figure 1. Example of device level cast scalar multi-profile plot
Behaviour when no data is retrieved
If the requested search range does not contain any data a plot is created with "Missing Data Detected" displayed in each profile plot. These "Missing Data Detected" plots are generated for each deployment in the search range. An example of this type of missing data plot can be seen below as figure 2.
 |
|
Figure 2. Example of "Missing Data Detected" plot
Revision History
- 20190601: Initial cast scalar multi-profile plot data products released
- 20191101: Integration with Oceans 3.0 Datasearch
Formats
PNG / PDF
Oceans 3.0 API filter: extension={png,pdf}
This data product is available in both PNG and PDF formats. If PDF is selected all plots created in one search will be collated into one PDF document, PNG format does not collate, the plots remain separate files.
Data Product Options
There are two data product options that are always selected, these options are shown to represent the processing that is always applied to this data product and are therefore always selected. Also, there are options to configure the processing parameters used when calculating Aligned and Depth Binned sensors
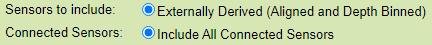
Oceans 3.0 API filter: includePiggybackSensors=0,sensorstoinclude=1
Configurable Cast Processing Options
Selecting non-default values for either the Cast Processing Bin Size or Cast Processing Percent Acceptance for Bin will result in Aligned and Depth Binned data being calculated on the fly from cleaned raw data and will take longer to generate a data product as a result. Files that contain data calculated on the fly will have "-onTheFly" in their filename, and the ProcessingDate header information will be the time of file generation in UTC. For files calculated on the fly with no binning selected then the column labels will contain "aligned" after the sensor name. For files calculated on the fly with binning selected the column labels will contain "aligned and depth-binned" after the sensor name.
Cast Processing Bin Size

This data product option controls the size of the bins the data is averaged into in meters. The default bin size is one-meter bins. Data is only averaged into its corresponding bin if the number of data points within the bounds of a bin with a QAQC flag of 1 meets the percent acceptance threshold (the default percent acceptance value is 70%). The bin size can be user set between zero meters to ten meters. The "No Binning" option can also be selected which will result in the data not being averaged.
For example, a bin size of 2 meters will have bin bounds from 1m to 3m, 3m to 5m, 5m to 7m, etc. The data within these depth bounds are averaged into one value if the percent acceptance threshold is met, which places the averaged values at 2m, 4m, 6m, etc.
Default - Oceans 3.0 API filter: dpo_binSize=-1
No Binning - Oceans 3.0 API filter: dpo_binSize=-2
Configurable Bin Size - Oceans 3.0 API filter: dpo_binSize=0 to dpo_binSize=10
Cast Processing Percent Acceptance for Bin
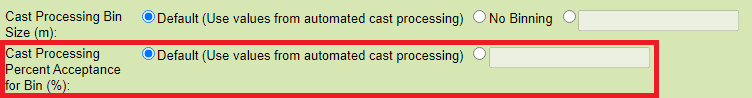
This data product option controls the percent acceptance threshold applied to data during the binning process. The default percent acceptance value is 70%. Data is only averaged into its corresponding bin if the number of data points within the bounds of a bin with a QAQC flag of 1 meets the percent acceptance threshold which is user-configurable with this data product option. The percent acceptance value can be set between zero percent to one hundred percent.
For example, if 7 data points out of 10 in a bin have a QAQC flag of 1 and the percent acceptance threshold is set to 70% the averaged value for the bin will be calculated from the 7 data points with a QAQC flag of 1. If the percent acceptance value is 80% then no value will be calculated for the bin as less than 80% of the data within the bin is has a QAQC flag of 1.
Default - Oceans 3.0 API filter: dpo_percentAcceptance=-1
Configurable Percent Acceptance - Oceans 3.0 API filter: dpo_percentAcceptance=0 to dpo_percentAcceptance=100
Selectable Sensors Plotted Options
The sensors plotted and their order can be configured with select options for the Cast Scalar Multi Profile Plot dataproduct. This option allows for 1 to 6 sensors to be plotted in an image.
The default sensor for positions 1 to 4 is as follows. A default plot example can also be seen in the documentation for dataproduct 139:
position 1: Temperature,
position 2: Practical Salinity,
position 3: Chlorophyll,
position 4: Oxygen Saturation

An example of one sensor plotted:

An example of six sensors plotted:

Note that some of the sensors presented are not applicable to all device packages. If the device package does not have a specifically requested sensor then an empty plot is created for the sensor in that position. In the following example, Oxygen Concentration was selected to be plotted in position 5, however, the device package that gathered the data in the image does not have a Oxygen Concentration sensor:

Oceans 3.0 API filter: dpo_sensorPlotPosition1=Default
or any of the following: Conductivity, Density, Practical_Salinity, Pressure, Abs_Pressure, Sound_Speed, Temperature, Turbidity, Chlorophyll, Oxygen_Saturation, Oxygen_Concentration, CDOM
Oceans 3.0 API filter: dpo_sensorPlotPosition2=Default
or any of the following: Conductivity, Density, Practical_Salinity, Pressure, Abs_Pressure, Sound_Speed, Temperature, Turbidity, Chlorophyll, Oxygen_Saturation, Oxygen_Concentration, CDOM, No
Oceans 3.0 API filter: dpo_sensorPlotPosition3=Default
or any of the following: Conductivity, Density, Practical_Salinity, Pressure, Abs_Pressure, Sound_Speed, Temperature, Turbidity, Chlorophyll, Oxygen_Saturation, Oxygen_Concentration, CDOM, No
Oceans 3.0 API filter: dpo_sensorPlotPosition4=Default
or any of the following: Conductivity, Density, Practical_Salinity, Pressure, Abs_Pressure, Sound_Speed, Temperature, Turbidity, Chlorophyll, Oxygen_Saturation, Oxygen_Concentration, CDOM, No
Oceans 3.0 API filter: dpo_sensorPlotPosition5=No
or any of the following: Conductivity, Density, Practical_Salinity, Pressure, Abs_Pressure, Sound_Speed, Temperature, Turbidity, Chlorophyll, Oxygen_Saturation, Oxygen_Concentration, CDOM
Oceans 3.0 API filter: dpo_sensorPlotPosition6=No
or any of the following: Conductivity, Density, Practical_Salinity, Pressure, Abs_Pressure, Sound_Speed, Temperature, Turbidity, Chlorophyll, Oxygen_Saturation, Oxygen_Concentration, CDOM
Discussion
To comment on this product, click Write a comment... below.