Data files for Kongsberg Mesotech Rotary Sonar instruments are described here. In the sweep mode, the sonar does a 360 degrees sweep of the nearby water and seabed. For SCAN mode, see this page.
This data is available in LOG, SMB and MAT format (the LOG file is a internal ONC format). LOG files are created daily at midnight UTC from data acquired throughout the day. Shortly thereafter, the data products are processed from the LOG files and are made available to data search. Content descriptions are provided below.
Plots are available in PNG and PDF format.
This binary format is specific to the manufacturer. When using Kongsberg Mesotech data acquisition software, data is normally stored in this way. Although we use custom-built drivers to communicate with our instruments, we can use the raw data in the log file to produce the SMB file which can be interpreted by Kongsberg Mesotech MS 1000 post-processing software.
This format is further described in the manufacturer's documentation: 900-00007904-2.1.pdf. The MATLAB library we use to produce MAT file and plots from SMB files is available upon request.
This data product has been tested mostly with MS 1000 version 4.51, while the new version, 5.2, also tests well. Historic data has been reprocessed and sweep SMB files should be fully available. If a data search returns with 'No data found' when the data availability shows that there is data, please contact us and we will be happy to investigate.
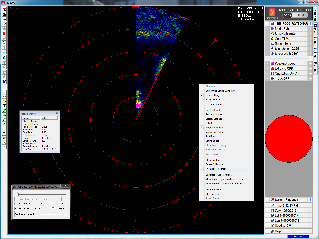
The MS 1000 software (Kongsberg Mesotech, http://www.kongsberg-mesotech.com) is free to redistribute for playback of the data. Download the MS Windows version here: MS1000_V0520_unlocked.zip. Then unzip and run MS1000_V0520_Setup.exe. To view the data, run the MS1000 software and press the play button. Alternatively, double-click an SMB file to launch the software in playback mode. The fast-forward function is useful for viewing the data quickly.
Previous versions of the MS1000 software did not directly support the high sample rate that our rotary sonars operate at. To make older versions work, right-click on the image and select 'Fit Image To Screen'.
In some cases, the software does not update the image promptly. Wiggle your mouse and the display will update. (It appears to be a limitation of the software and graphical capability of one's computer, we're investigating.) The fast forward function of the software is very useful to view a large amount of data quickly.

MAT files (v7) can be opened using MathWorks MATLAB 7.0 or later. The file contains two structures: Meta and Data.
Data: structure containing the Kongsberg rotary sonar data, tightly based on the tuple structure of SMB files. Only the important fields are listed below. For more information, refer to the SMB file specfication: 900-00007904-2.1.pdf. Please note that not all structures and fields available in the SMB files are converted and provided in the MAT file all of the time. If there is anything missing or something to be improved, please contact us, we'll be happy to make improvements.
These structures are from the sonar ping tuple:
Here is the settings tuple:
Here is the date tuple:
Additional tuples for heading, location maybe added in the future.
The PNG / PDF plot data products mirror the display of the Kongsberg MS1000 software, but break each rotation into separate plots so that no data is overwritten or has to be averaged. The raw backscatter amplitude is plotted as contained in the MAT file: 16 bit data ranges from 0 to 65535, 8 bit ranges from 0 to 255. The backscatter data is not calibrated. For each source SMB file, there are two types of plots returned: a plot of the sonar pointing / heading angle as a function of time (called 'SonarAngle') and multiple backscatter polar plots (called 'Backscatter'). The SonarAngle plot has numbered annotations showing the start of each corresponding numbered Backscatter plot. In the examples below, the SonarAngle plot shows that five Backscatter plots will be created for this SMB source file. The PDF version of this data product will group this plots into a single PDF file with multiple pages. Please note that these examples are of test tank data; real data looks much better.


The algorithms for detecting each rotation and for making the plots are somewhat complex. Contact us if you are interested in the source code for these plots, which would be useful for analyzing the data from the MAT files.
To comment on this product, click Add Comment below.