Cast Scalar Profile Data
Device-level and sensor-level cast scalar profile data products are time or cast delimited scalar products for profile data. Currently, we don't offer the cast-delimited option (future release: a cast is defined as a single pass through the water column). Currently, only plots are available for all Pacific Salmon Foundation (PSF) profiling CTDs, Oxygen Sensors and Fluorometers. This data is acquired in partnership with PSF for their Salish Sea Marine Survival program where community based fisher go out regularly and collect CTD casts at various locations. See here in Data Search: http://dmas.uvic.ca/DataSearch?location=SSMSP Cast scalar data products produce a plot of the casts over a user specified time-range with the option of breaking them into daily plots. The CTD and instrument package is lowered to a depth of approximately 150 m and then brought up to surface taking measurements along its way.
Please consult individual instruments' documentation for more information.
Revision History
- 20160901: Initial Release
Data Product Options
Sensors to Include

Corrected
A corrected version of the original sensor data that has been re-calculated to factor in variables such as falling speed to improve accuracy. “-Corrected” is added at the end of the filename.
Original
The original sensor data as it is received from the CTD.
Quality Control

Pre-processed clean corrected data (uses raw QAQC filter as pass through only)
There is no quality control option when corrected is chosen for the sensors to include option. The corrected data has already passed through the raw QAQC filter.
Clean Data
If the original sensors are selected, the clean data option will apply the QAQC filter to the data. “-clean” is added at the end of the filename.
Raw Data
If the original sensors are selected, the raw data option will return the data as it is received from the CTD.
File / Plot Break
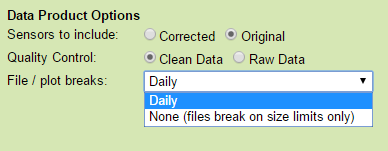
Daily
The time range specified will be broken up daily and a plot will be produced for each day.
None (files break on size limits only)
The time range specified will only be broken up if it exceeds the file size limit.
Formats
PNG / PDF: Cast Scalar Profile Data
This data is available as PNG or PDF format plots. See the pages on the PNG and PDF plots.
Cast Scalar Profile plots are plots of Depth versus the variable or sensor being plotted. These are the standard CTD cast-type plots. Multiple sensors maybe plotted on multiple x-axes for device-level plots.
For device level plots, for CTDs, we put density, temperature and practical salinity in the first plot, with specific colours while the remaining sensors are plotted in subsequent plots. The second plot contains conductivity and sound speed vs depth. Each plot is colour coded to improve readability. The second plot will have “_2” added on the end of the filename. Here is an example of a device level plot search resulting in two plots:


Here is an example of single sensor plot:

Discussion
To comment on this product, click Add Comment below.