Here are all the options pages. More details on the options below.
Scalar Data Product Options
Applies to scalar data products, such as the time series scalar data and plots and the plot variants such as the staircase plot or profile plot.
Quality ControlFor time series scalar data:
Raw Data
When this option is selected, raw data will be supplied in the data products: no action is taken to modify the data. In general, all scalar data is associated with a quality control flag. These flags are stored adjacent to the data values.
Oceans 3.0 API filter: dpo_qualityControl=0
Clean Data
Selecting this option will cause any data values with quality control failures (QAQC flags 3, 4 and 6) to be replaced with NaNs. If the do not fill data gaps option is selected, data values with quality control failures will be removed. For all data products, when resampling with the clean option, any data with quality control failures are removed prior to the resampling (this rule applies to all resampling types: average, min/max, etc).
This is the default option for all data products.
Oceans 3.0 API filter: dpo_qualityControl=1
File-name mode field
'clean' is added to the file-name when the quality option is set to clean data.
For time series scalar plots:
Raw Data
When this option is selected, raw data will be supplied in the data products: no action is taken to modify the data. In general, all scalar data is associated with a quality control flag. For plots, such as the time series scalar plot, data that fail quality control are marked on the plot with coloured data points and flag markers for emphasis.
Oceans 3.0 API filter: dpo_qualityControl=0
Clean Data
Selecting this option will cause any data values with quality control failures (QAQC flags 3, 4 and 6) to be replaced with NaNs. Because NaNs cannot be plotted, quality control failures will be excluded from any plots under the clean option. For all data products, when resampling with the clean option, any data with quality control failures are removed prior to the resampling (this rule applies to all resampling types: average, min/max, etc).
This is the default option for all data products.
Oceans 3.0 API filter: dpo_qualityControl=1
File-name mode field
'clean' is added to the file-name when the quality option is set to clean data.
Raw Data
When this option is selected, raw data will be supplied in the data products: no action is taken to modify the data. In general, all scalar data is associated with a quality control flag. These flags are stored adjacent to the data values.
Oceans 3.0 API filter: dpo_qualityControl=0
Clean Data
Selecting this option will cause any data values with quality control failures (QAQC flags 3, 4 and 6) to be replaced with NaNs. If the do not fill data gaps option is selected, data values with quality control failures will be removed. For all data products, when resampling with the clean option, any data with quality control failures are removed prior to the resampling (this rule applies to all resampling types: average, min/max, etc).
This is the default option for all data products.
Oceans 3.0 API filter: dpo_qualityControl=1
File-name mode field
'clean' is added to the file-name when the quality option is set to clean data.
Raw Data
When this option is selected, raw data will be supplied in the data products: no action is taken to modify the data. In general, all scalar data is associated with a quality control flag. For plots, such as the time series scalar plot, data that fail quality control are marked on the plot with coloured data points and flag markers for emphasis.
Oceans 3.0 API filter: dpo_qualityControl=0
Clean Data
Selecting this option will cause any data values with quality control failures (QAQC flags 3, 4 and 6) to be replaced with NaNs. Because NaNs cannot be plotted, quality control failures will be excluded from any plots under the clean option. For all data products, when resampling with the clean option, any data with quality control failures are removed prior to the resampling (this rule applies to all resampling types: average, min/max, etc).
This is the default option for all data products.
Oceans 3.0 API filter: dpo_qualityControl=1
File-name mode field
'clean' is added to the file-name when the quality option is set to clean data.
Data GapsFor time series data only:
Fill missing/bad data with NaNs (Not Number)
This option will, as it says, fill in data gaps with 'NaN' values in the data products. For CSV files, the text 'NaN' is inserted, while MAT files have a built-in type of the same name. Data gaps occur when the time difference between subsequent readings is greater than 1.9 times the sample period (otherwise known as the data rating). The NaNs are placed one sample period after the last reading before the data gaps. Gaps are only filled between readings.
This option will also keep any existing NaNs in the data. These are most often caused by the clean data option being selected, or by real NaNs being report, or when a sensor in a multi-sensor data product has no data. Available metadata can elaborate on the QAQC test that was applied (this information is available via Oceans 3.0 and in MAT files).
This is the default option.
Oceans 3.0 API filter: dpo_dataGaps=1
Do not fill gaps
This option will not take action to fill in data gaps.
This option will cause action to be taken to remove all NaNs in the data. The main implication of this is if the clean option had been selected, data that failed quality control tests will be removed entirely. However, there is an exception to this: for multi-sensor time series scalar data, if one sensor at a given time stamp has valid data, the entire row/time stamp cannot be removed, so the remaining sensors will be left as NaNs. For clarification, see the following example, note that QAQC flags of 1s are good data, 4s are failures and 9s are missing data:
sample time
sensor 1
sensor 1 flag
sensor 2
sensor 2 flag
Comment
12:00:00
42
1
42
1
Good row.
12:00:01
NaN
4
NaN
9
Two bad values; one QAQC failure, one data gap. If the do not fill gaps is selected, this entire row will be removed.
12:00:02
NaN
4
44
1
One good value, can't remove row.
File-name mode field
'NaN' is added to the file name when the data gaps are filled with NaNs.
Oceans 3.0 API filter: dpo_dataGaps=0
Fill missing/bad data with NaNs (Not Number)
This option will, as it says, fill in data gaps with 'NaN' values in the data products. For CSV files, the text 'NaN' is inserted, while MAT files have a built-in type of the same name. Data gaps occur when the time difference between subsequent readings is greater than 1.9 times the sample period (otherwise known as the data rating). The NaNs are placed one sample period after the last reading before the data gaps. Gaps are only filled between readings.
This option will also keep any existing NaNs in the data. These are most often caused by the clean data option being selected, or by real NaNs being report, or when a sensor in a multi-sensor data product has no data. Available metadata can elaborate on the QAQC test that was applied (this information is available via Oceans 3.0 and in MAT files).
This is the default option.
Oceans 3.0 API filter: dpo_dataGaps=1
Do not fill gaps
This option will not take action to fill in data gaps.
This option will cause action to be taken to remove all NaNs in the data. The main implication of this is if the clean option had been selected, data that failed quality control tests will be removed entirely. However, there is an exception to this: for multi-sensor time series scalar data, if one sensor at a given time stamp has valid data, the entire row/time stamp cannot be removed, so the remaining sensors will be left as NaNs. For clarification, see the following example, note that QAQC flags of 1s are good data, 4s are failures and 9s are missing data:
sample time | sensor 1 | sensor 1 flag | sensor 2 | sensor 2 flag | Comment |
|---|---|---|---|---|---|
12:00:00 | 42 | 1 | 42 | 1 | Good row. |
12:00:01 | NaN | 4 | NaN | 9 | Two bad values; one QAQC failure, one data gap. If the do not fill gaps is selected, this entire row will be removed. |
12:00:02 | NaN | 4 | 44 | 1 | One good value, can't remove row. |
File-name mode field
'NaN' is added to the file name when the data gaps are filled with NaNs.
Oceans 3.0 API filter: dpo_dataGaps=0
Resampling

Resample Type:
None - no resampling. This is the default option for time series scalar data.
Oceans 3.0 API filter:
dpo_resample=none
Average - the mean value within resample period (fixed-window averaging without overlap). This is also known as a 'box-car' or ensemble average. It is subject to the 70% data completeness QAQC check (see below) with the exception of engineering data or data from irregular or scheduled sampling. Only available with the clean data product option.
Oceans 3.0 API filter:
dpo_resample=averageMin/Max - the most extreme minimum and maximum values within resample period. It is subject to the 70% data completeness QAQC check (except for engineering data or data from irregular or scheduled sampling); QAQC flags are taken from the extreme data points.
Oceans 3.0 API filter:
dpo_resample=minMaxanddpo_minMax={0, 60, 600, 900, 3600, 86400}Min/Max+Avg - the combination of the min/max and average as described above. The average is always calculated from clean data and will be NaN if there is less than 70% data available after cleaning. QAQC flags for min/max+avg with automatic resampling are the worst flag in the resample period, which includes the 70% check on data completeness (except for engineering data or data from irregular or scheduled sampling). This is the default option for time series scalar plots - other plots, such as the BHT, AGO, profile or staircase plots will have different options and defaults.
Oceans 3.0 API filter:
dpo_resample=minMaxAvganddpo_minMaxAvg={0, 60, 600, 900, 3600, 86400}
Resample Period:
Visible when an actionable resample type is selected, immediately to the right of the resample type. Current periods offered:
1 Minute:
Oceans 3.0 API filter:
dpo_average=6010 Minute:
Oceans 3.0 API filter:
dpo_average=60015 Minute:
Oceans 3.0 API filter:
dpo_average=9001 Hour:
Oceans 3.0 API filter:
dpo_average=36001 Day:
Oceans 3.0 API filter:
dpo_average=86400
When resampling is selected:
- The timestamps in the data series correspond to the centre of each resampling interval. (Data downloaded prior to 13 Feb 2013: timestamps were at beginning of interval). The resample interval always begins and ends at an integer multiple of the resample period, so minutes on the minute, hours on the hour, days on the day, etc.
- If the date/time range on the search has limits that are within a resampling interval, the date/time endpoints are extended to include the entire resampling interval. For example, when daily resampling is selected from 03:00:00.000 on Monday to 20:00:00.000 on Thursday, the date range is extended to 00:00:00.000 on Monday to 23:59.59.999 on Thursday.
- Note that tides are not filtered out in resampled products.
- No anti-alias filtering is done. This is why only averaging and min/max are offered at this time. Box-car / ensemble averaging is an easily understood and ubiquitous process that is an effective low-pass anti-alias filter. For more information, see this page on data reduction and time-averaging.
- Spatial / mobile data may be resampled, but users are warned against this procedure, as it may be inappropriate to do so. Spatial averages or a geospatial display of the non-resampled data may be a better approach.
- All resampled data products are subject to an additional QAQC check on data completeness (except engineering data or data from irregular or scheduled sampling). If any resample period does not contain at least 70% of the expected data, the QAQC flag for this period will be a failure (6), unless overridden by a manual QAQC flag, see the QAQC page. For live data, it is quite likely that the last resample period will not be complete and will be flagged; this is especially obvious for plots. Future improvements will allow users to modify the data completeness threshold.
More options will be available in the future as we work to improve the data products. Feedback is welcomed and encouraged. For custom resampling, users can develop their own matlab code in the Oceans 3.0 Sandbox and run it in the ONC computing environment.
File-name mode field
The resample type and period are added to the file-name when resampling is selected. Example: 'avg1hour', 'MinMax10minute'.
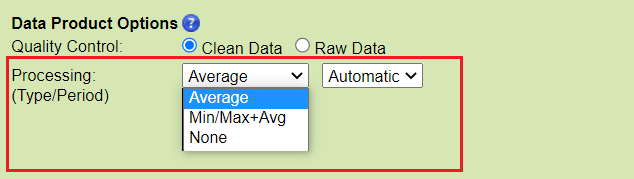
Resample Type:
None - no resampling.
Oceans 3.0 API filter: dpo_resample=none
Average - the mean value within resample period (fixed-window averaging without overlap). This is also known as a 'box-car' or ensemble average. It is subject to the 70% data completeness QAQC check (see below) with the exception of engineering data or data from irregular or scheduled sampling. Only available with the clean data product option.
Oceans 3.0 API filter: dpo_resample=average and dpo_average={0, 60, 600, 900, 3600, 86400}
Min/Max - the most extreme minimum and maximum values within resample period. It is subject to the 70% data completeness QAQC check (except for engineering data or data from irregular or scheduled sampling); QAQC flags are taken from the extreme data points.
Oceans 3.0 API filter: dpo_resample=minMax and dpo_minMax={0, 60, 600, 900, 3600, 86400}
Min/Max+Avg - the combination of the min/max and average as described above. The average is always calculated from clean data and will be NaN if there is less than 70% data available after cleaning. QAQC flags for min/max+avg with automatic resampling are the worst flag in the resample period, which includes the 70% check on data completeness (except for engineering data or data from irregular or scheduled sampling). This is the default option for time series scalar plots, other plots, such as the BHT, AGO, profile or staircase plots will have different options and defaults.
Oceans 3.0 API filter: dpo_resample=minMaxAvg and dpo_minMaxAvg={0, 60, 600, 900, 3600, 86400}
Resample Period:
Visible when an actionable resample type is selected, immediately to the right of the resample type. Current periods offered:
Automatic:
Oceans 3.0 API filter:
dpo_average=0
1 Minute:
Oceans 3.0 API filter:
dpo_average=6010 Minute:
Oceans 3.0 API filter:
dpo_average=60015 Minute:
Oceans 3.0 API filter:
dpo_average=9001 Hour:
Oceans 3.0 API filter:
dpo_average=36001 Day:
Oceans 3.0 API filter:
dpo_average=86400
When resampling is selected:
- The timestamps in the data series correspond to the centre of each resampling interval. (Data downloaded prior to 13 Feb 2013: timestamps were at beginning of interval). The resample interval always begins and ends at an integer multiple of the resample period, so minutes on the minute, hours on the hour, days on the day, etc.
- If the date/time range on the search has limits that are within a resampling interval, the date/time endpoints are extended to include the entire resampling interval. For example, when daily resampling is selected from 03:00:00.000 on Monday to 20:00:00.000 on Thursday, the date range is extended to 00:00:00.000 on Monday to 23:59.59.999 on Thursday.
- Note that tides are not filtered out in resampled products.
- No anti-alias filtering is done. This is why only averaging and min/max are offered at this time. Box-car / ensemble averaging is an easily understood and ubiquitous process that is effective as a low-pass anti-alias filter. For more information, see this page on data reduction and time-averaging.
- Spatial / mobile data may be resampled, but users are warned against this procedure, as it may be inappropriate to do so. Spatial averages or a geospatial display of the non-resampled data may be a better approach.
- All resampled data products are subject to an additional QAQC check on data completeness (except engineering data or data from irregular or scheduled sampling). If any resample period does not contain at least 70% of the expected data, the QAQC flag for this period will be a failure (6), unless overridden by a manual QAQC flag, see the QAQC page. For live data, it is quite likely that the last resample period will not be complete and will be flagged; this is especially obvious for plots. Future improvements will allow users to modify the data completeness threshold.
- Automatic resampling chooses the most appropriate resample period for min/max or min/max+avg resampling, such that the amount of data returned is adequate for plotting. For short duration plots, it can result in no resampling.
More options will be available in the future as we work to improve the data products. Feedback is welcomed and encouraged. For custom resampling, users can develop their own matlab code in the Oceans 3.0 Sandbox and run it in the ONC computing environment.
File-name mode field
The resample type and period are added to the file-name when resampling is selected. Examples: 'avg1hour', 'MinMax10minute', 'MinMaxAvgAuto15minute', 'MinMaxAvgAuto' (automatic resampling chose no resampling).
Complex Data Product Options
For non-scalar data products, the options are more varied and are specific to the device and data formats provided.
Many options are not yet released. Planned options include, but are not limited to, ensemble averaging selections and plotting options for ADCP data.
Hydrophone Channel

H1
This option will cause the search to return results for hydrophone channel H1 only. The hydrophone arrays consist of multiple hydrophones connected to a single data acquisition computer, which collects the data into single files that have multiple channels (nominally raw hydrophone array files, although other formats can handle multiple channels). Data products may be produced from these files on a per channel basis and returned as specified.
This is the default option.
Oceans 3.0 API filter: dpo_hydrophoneChannel=H1
File-name mode field
'H1' is added to the file-name when the hydrophone channel option is set to H1, i.e. IOS3HYDARR02_20111211T152404.000Z-spect-H1.pdf.
H2
This option will cause the search to return results for hydrophone channel H2 only.
Oceans 3.0 API filter: dpo_hydrophoneChannel=H2
File-name mode field
'H2' is added to the file-name when the hydrophone channel option is set to H2, i.e. IOS3HYDARR02_20111211T152404.000Z-spect-H2.png.
H3
This option will cause the search to return results for hydrophone channel H3 only.
Oceans 3.0 API filter: dpo_hydrophoneChannel=H3
File-name mode field
'H2' is added to the file-name when the hydrophone channel option is set to H3, i.e. IOS3HYDARR02_20120801T090939.000Z-H3.mp3.
All
This option will cause the search to return results for all available hydrophone channels.
Oceans 3.0 API filter: dpo_hydrophoneChannel=All
File-name mode field
'H1', 'H2', 'H3', etc are added to the file-name.
Hydrophone Data Diversion Mode
Hydrophone Spectrogram Source

Audio Data Preferred (FFT spectral data fills in gaps only)
In this default option, searches for spectrogram data products will return the best combination of spectrograms sourced from .wav or .hyd audio data files and sourced from FFT spectral data files. Hydrophones produce audio data and spectrograms are best generated from the audio data. However, in some circumstances, such as low bandwidth data connections to remote hydrophones or military diversion, audio data is not available and we only receive spectral FFT data files. Spectrograms produced from FFT data files fill in the gaps where with normal audio data sourced spectrograms are not available. This presents the user with the most complete coverage of data.
Oceans 3.0 API filter: dpo_spectrogramSource=MIX
Audio data only
This option will cause the search to only return spectrograms sourced from audio data. This is useful if you just want the high resolution spectrograms.
Oceans 3.0 API filter: dpo_spectrogramSource=WAV
.fft Spectral Data only (maybe available regardless of data diversion mode)
This option will cause the search to only return spectrograms sourced from FFT spectral data files. This is useful when audio data is present, but is limited in bandwidth due to military diversion. FFT sourced spectrograms have less resolution than audio sourced spectrograms but often have frequency ranges from 0 to well above 44 kHz (audio data is often limited to 44 kHz sampling)..
Oceans 3.0 API filter: dpo_spectrogramSource=FFT
File-name mode field
Spectrograms produced from .fft spectral data files are appended with a '-FFT', and are also noted as such within the plots themselves.
Hydrophone Spectral Probability Density Colour Axis Upper Limit

Automatic
In this default option, it sets the upper limit of the colour axis to a value that's the nearest 0.1 (unit-less) to the 98th percentile of the empirical probability density. The empirical probably density is generally the most relevant at values less than 0.25. Only in small data sets or extreme frequency / sound level bins does one see values approach the maximum value of 1.0. For this reason, the manual fixed limit options are clusters at the lower values. The spectral probability density plots from Merchant et al. (2013) all had fixed upper limit values of 0.05. The lower limit is always 0.0.
Oceans 3.0 API filter: dpo_spectralProbabilityDensityColourAxisUpperLimit=0
Manual fixed limit settings (0.05, 0.01, 0.012, 0.25 0.5, 1.0)
This option will cause the spectral probability density plot to use a fixed value, as chosen, for the colour axis upper limit.
Oceans 3.0 API filter: dpo_spectralProbabilityDensityColourAxisUpperLimit={0.05,0.01,0.012,0.25,0.5,1.0}
File-name mode field
Spectral probability density plots generated with the manual limits will have a file mode modifier added to their file names of the format: <-CLIMIT><option> where <option> is the value as chosen, but without the '.'.
Echosounder Resampling and Calibration
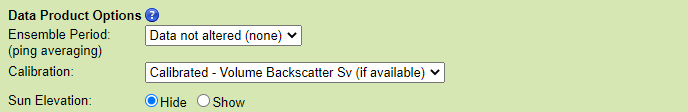
Ensemble Period (ping averaging)
This option will cause the search to perform the standard box-car average resampling on the data. 'Boxes' of time are defined based on the ensemble period, e.g. starting every 15 minutes on the 15s, with the time stamp given as the center of the 'box'. Acoustic pings that occur within that box are averaged range or bin-wise, and the summary statistics, such as 'Data.nPingsAcquired' (from ASL time series MAT files) are updated. This process is often called 'ping averaging'. The process uses log scale averaging, which involves backing out the dB scale to pressure, compute the weighted average, and then compute the dB scale again. Weighted averages are used when raw files bridge an ensemble period and when the data is already an ensemble or ping average.
New files are started when the maximum records per file is exceeded (files will not exceed 1 GB of memory when loaded), or when there is a configuration, device or site changes. In the case where there is data from either side of a configuration change within one ensemble period, two files will be produced with the same ensemble period, the same time stamps, but different data. Users may use the ensemble statistics on the number of pings or samples per ensemble to filter out ensembles that do not have enough data. (As an aside, we do this by default with clean averaged scalar data - each ensemble period needs to have at least 70% of it's expected data to be reported as good.)
For plotting data products, the requested ensemble period may be overridden to prevent image aliasing (one ensemble period is prevented from being smaller than one pixel). Also, the requested ensemble period also selects if the plots are broken daily (none option) or allowed to span multiple days (breaks still occur at configuration changes and internal data/memory limits).
The default value for this option is no averaging, meaning the data is not altered.
Some echosounders are configured to do ping averaging during acquisition, so the data you request with with 'Data not altered (none)' could already be averaged. To determine if the echosounder is averaging data as it is acquiring it, check the device details page (e.g. http://dmas.uvic.ca/DeviceListing?DeviceId=22608, go to the additional attributes tab) or check the data products: see the comment field in the plots or the Config structure in MAT files, look for Config.p in the ASL time series (BioSonics echosounder don't usually do any onboard averaging). Available ensemble periods are 0.5, 1, 5, 10, 15 and 60 minutes.
Data not altered
Oceans 3.0 API filter:
dpo_ensemblePeriod=030 Seconds
Oceans 3.0 API filter:
dpo_ensemblePeriod=201 Minute
Oceans 3.0 API filter:
dpo_ensemblePeriod=605 Minute
Oceans 3.0 API filter:
dpo_ensemblePeriod=30010 Minute
Oceans 3.0 API filter:
dpo_ensemblePeriod=60015 Minute
Oceans 3.0 API filter:
dpo_ensemblePeriod=9001 Hour
Oceans 3.0 API filter:
dpo_ensemblePeriod=3600
File-name mode field
Selecting an ensemble period will add 'Ensemble' followed by the ensemble period. For example '-Ensemble600s'.
Calibration
This option will apply the calibration to the data, when the calibration coefficients are available. The calibration calculation and coefficients are supplied by the manufacturer. See the device details page (additional attributes tab) to see the coefficients, see the instrument documentation page, or contact us for more details. These values are also provided in the MAT file products; see the Config / Cal structure for ASL data products and the data.snd.rxee structure for BioSonics data products.
The default value is to apply calibration and calculate the Volume Backscatter when available. Users may also choose a Target Strength calculation for calibrated data The former is used to estimate bio-mass of schools or aggregations, with the latter is useful with single large targets such as predatory fish (for more information see the format descriptions). The uncalibrated option will provide the raw data only. Raw data has units of raw counts, which are proportional to the received acoustic pressure.
Calibrated - Volume Backscatter Sv (if available)
Oceans 3.0 API filter:
dpo_calibration=1Calibrated - Target Strength TS (if available)
Oceans 3.0 API filter:
dpo_calibration=2Uncalibrated (raw pressure)
Oceans 3.0 API filter:
dpo_calibration=0
File-name mode field
'CalibratedSv' or 'CalibratedTS' will be added if all the channels of the device were successfully calibrated (for Volume Backscatter or Target Strength, respectively).
Sun Elevation
This option applies to echosounder plots only. If 'Show' is selected, it appends a graph of the Sun's elevation over time below the acoustic data, such a plot is useful to correlate the acoustic data with dial (daily) and tidal effects, such as zooplankton migrations.
The default will not add a plot of sun elevation.
Hide
Oceans 3.0 API filter:
dpo_sunElevation=0Show
Oceans 3.0 API filter:
dpo_sunElevation=1
File-name mode field
No affect on file-name.
ADCP Ensemble Averaging and Bin-Mapping
CODAR Options
Imagenex Options
Daily or Scan-Separated Files
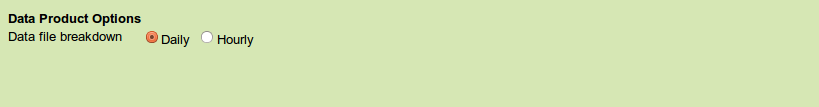
For .txt and .81a data, this option determines whether a specified time range of downloaded data will be split into files by day or by scan. An Imagenex rotary sonar will perform one scan every hour.
- Daily
Oceans 3.0 API filter:dpo_datafilebreakdown=0 - Hourly
Oceans 3.0 API filter:dpo_datafilebreakdown=1
File-name mode
'-daily' or '-hourly' will be appended to the file-name.