Kistler Accelerometer Data
Processed data products for Kistler Accelerometers are described here. For Kistler Accelerometer raw binary files acquired directly from the instrument, see here. Kistler processed data products are produced from each raw file, which normally contain 5 minutes of data. Processed products are available in three formats. The MAT file contains the raw, uncalibrated data parsed into MATLAB-readable format, while the PNG/PDF plot products are spectrograms of the acceleration along the X, Y, Z instrument axes. The calibration documentation (Kistler_CalSheet_2013.pdf) will be bundled with all data product requests; this data is used to calibrate the spectrograms only. Contact us for more information. Also, see the manufacturer's website: http://www.kistler.com/ca/en/products/components/acceleration-sensors/.
Oceans 3.0 API filter: dataProductCode=KAD
Revision History:
- 20150805: Data product migrated from VENUS data download
Formats
MAT file Raw Data
MAT files contain the raw uncalibrated data. The data is contained in the KisterData structure, accompanied by the usual metadata structure. The structures and fields are described below.
KistlerData: a structure containing the following raw data fields:
- matlabtime: vector of time stamps for each measurement in matlab datenum format: days since January 1, 0000.
- numChannels: number of sensors, should always be 4 (X,Y,Z uncalibrated acceleration and temperature).
- sampleRateHz: sample rate in Hz, usually 2560 Hz.
- waterproperty: cell array with names of the measured quantities
- Temperature / xAxisVolts / yAxisVolts / zAxisVolts: sensor data arrays, all are not calibrated (same length as matlabtime).
- Temperature_QCflag / xAxisVolts_QCflag / yAxisVolts_QCflag / zAxisVolts_QCflag: sensor data QAQC flag arrays, currently, these are all 0s (same length as matlabtime). See the QAQC pages for more information.
- Temperature_units / xAxisVolts_units / yAxisVolts_units / zAxisVolts_units: string containing the measurement unit, since the data is not calibrated, this is always 'V' for Volts.


- deviceID: A unique identifier to represent the instrument within the Ocean Networks Canada data management and archiving system.
- creationDate:Date and time (using ISO8601 format) that the data product was produced. This is a valuable indicator for comparing to other revisions of the same data product.
- deviceName: A name given to the instrument.
- deviceCode: A unique string for the instrument which is used to generate data product filenames.
- deviceCategory: Device category to list under data search ('Echosounder').
- deviceCategoryCode: Code representing the device category. Used for accessing webservices, as described here: API / webservice documentation (log in to see this link).
- lat: Fixed value obtained at time of deployment. Will be NaN if mobile or if both site latitude and device offset are null. If mobile, sensor information will be available in mobilePositionSensor structure..
- lon: Fixed value obtained at time of deployment. Will be NaN if mobile or if both site longitude and device offset are null. If mobile, sensor information will be available in mobilePositionSensor structure.
- depth: Fixed value obtained at time of deployment. Will be NaN if mobile or if both site depth and device offset are null. If mobile, sensor information will be available in mobilePositionSensor structure.
- deviceHeading: Fixed value obtained at time of deployment. Will be NaN if mobile or if both site heading and device offset are null. If mobile, sensor information will be available in mobilePositionSensor structure.
- devicePitch: Fixed value obtained at time of deployment. Will be NaN if mobile or if both site pitch and device offset are null. If mobile, sensor information will be available in mobilePositionSensor structure.
- deviceRoll: Fixed value obtained at time of deployment. Will be NaN if mobile or if both site roll and device offset are null. If mobile, sensor information will be available in mobilePositionSensor structure.
- siteName: Name corresponding to its latitude, longitude, depth position.
- locationName: The node of the Ocean Networks Canada observatory. Each location contains many sites.
- stationCode: Code representing the station or site. Used for accessing webservices, as described here: API / webservice documentation (log in to see this link).
- dataQualityComments: In some cases, there are particular quality-related issues that are mentioned here.
- MobilePositionSensor: A structure with information about sensors that provide additional scalar data on positioning and attitude (latitude, longitidue, depth below sea surface, heading, pitch, yaw, etc).
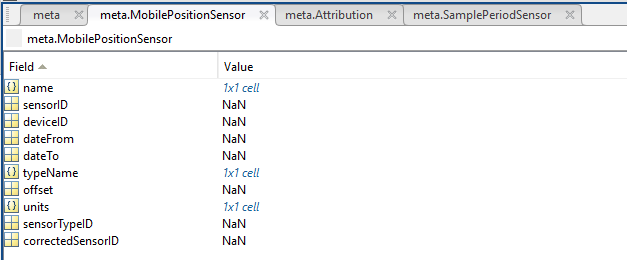
- name: A cell array of sensor names for mobile position sensors. If not a mobile device, this will be an empty cell string.
- sensorID: An array of unique identifiers of sensors that provide position data for mobile devices - this data may be used in this data product.
- deviceID: An array of unique identifiers of devices that provide position data for mobile devices - this data may be used in this data product.
- dateFrom: An array of datenums denoting the range of applicability of each mobile position sensor - this data may be used in this data product.
- dateTo: An array of datenums denoting the range of applicability of each mobile position sensor - this data may be used in this data product.
- typeName: A cell array of sensor names for mobile position sensors. If not a mobile device, this will be an empty cell string. One of: Latitude, Longitude, Depth, COMPASS_SENSOR, Pitch, Roll.
- offset: An array of offsets between the mobile position sensors' values and the position of the device (for instance, if cabled profiler has a depth sensor that is 1.2 m above the device, the offset will be -1.2m).
- sensorTypeID: An array of unique identifiers for the sensor type.
- correctedSensorID: An array of unique identifiers of sensors that provide corrected mobile positioning data. This is generally used for profiling deployments where the latency is corrected for: CTD casts primarily.
- deploymentDateFrom: The date of the deployment on which the data was acquired.
- deploymentDateTo: The date of the end of the deployment on which the data was acquired (will be NaN if still deployed).
- samplingPeriod: Sample period / data rating of the device in seconds, this is the sample period that controls the polling or reporting rate of the device (some parsed scalar sensors may report faster, some devices report in bursts) (may be omitted for some data products).
- samplingPeriodDateFrom: matlab datenum of the start of the corresponding sample period (may be omitted for some data products).
- samplingPeriodDateTo: matlab datenum of the end of the corresponding sample period (may be omitted for some data products).
- sampleSize: the number of readings per sample period, normally 1, except for instruments that report in bursts. Will be zero for intermittent devices (may be omitted for some data products).
- SamplePeriodSensor: A structure array with an entry for each scalar sensor on the device (even though this metadata is for complex data products that don't use scalar sensors).
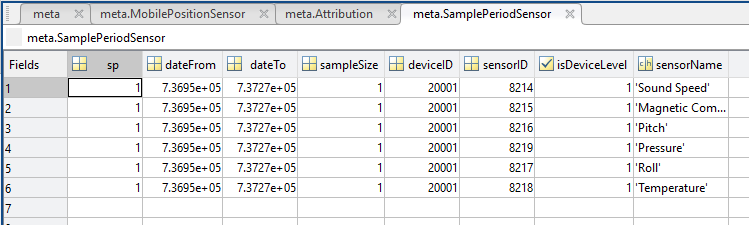
- sp: sample period in seconds (array), unless sensorid is NaN then this is the device sample period
- dateFrom: array of date from / start date (inclusive) for each sample period in MATLAB datenum format.
- dateTo: array of date to / end date (exclusive) for each sample period in MATLAB datenum format.
- sampleSize: the number of readings per sample period (array). Normally 1, except for instruments that report in bursts. Will be zero for intermittent devices.
- deviceID: array of unique identifiers of devices (should all be the same).
- sensorID: array of unique identifiers of sensors on this device.
- isDeviceLevel: flag (logical) that indicates, when true or 1, if the corresponding sample period/size is from the device-level information (i.e. applies to all sensors and the device driver's poll rate).
- sensorName: the name of the sensor for which the sample period/size applies (much more user friendly than a sensorID).
- citation: a char array containing the DOI citation text as it appears on the Dataset Landing Page. The citation text is formatted as follows: <Author(s) in alphabetical order>. <Publication Year>. <Title, consisting of Location Name (from searchTreeNodeName or siteName in ONC database) Deployed <Deployment Date (sitedevicedatefrom in ONC database)>. <Repository>. <Persistent Identifier, which is either a DOI URL or the queryPID (search_dtlid in ONC database)>. Accessed Date <query creation date (search.datecreated in ONC database)>
- Attribution: A structure array with information on any contributors, ordered by importance and date. If an organization has more than one role it will be collated. If there are gaps in the date ranges, they are filled in with the default Ocean Networks Canada citation. If the "Attribution Required?" field is set to "No" on the Network Console then the citation will not appear. Here are the fields:

- acknowledgement: the acknowledgement text, usually formatted as "<organizationName> (<organizationRole>)", except for when there are no attributions and the default is used (as shown above).
- startDate: datenum format
- endDate: datenum format
- organizationName
- organizationRole: comma separated list of roles
- roleComment: primarily for internal use, usually used to reference relevant parts of the data agreement (may not appear)
Oceans 3.0 API filter: extension=mat
PNG/PDF Spectrogram
Spectrograms of relative acceleration along the X,Y,Z instrument axes are provided in PNG/PDF format. As previously noted, the spectrogram is calibrated as per the calibration sheet. The calibration applies the bias voltage offset and the frequency dependent sensitivity, which converts millivolts to 1 g. The PDF format contains multiple spectrograms on multiple pages, while the PNG products will be separate files for each 5 minute spectrogram. Here is an example spectrogram:

Oceans 3.0 API filter: extension={png,pdf}
Discussion
To comment on this product, log in and click Write a comment... below.