...
The plots are very similar to the spectrograms produced by dataproduct 45 documented here: 45. However, there are additional options available with this data product.
Oceans 2.0 API filter: dataProductCode=SHV
Revision History
- 20190807 development started
Data Product Options
There are currently three data product options associated with this data product. Both alter the presentation of the data within the spectrogram.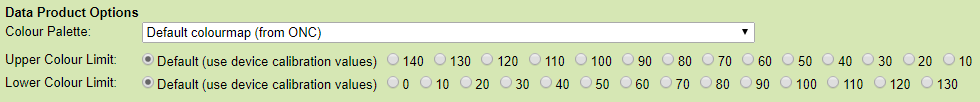

Colour Palette:
- Default colourmap (from ONC)
- Oceans 2.0 API filter:
spectrogramColourPalette = 0 - Sequential Blue to Purple (perceptually balanced - from colorbrewer.org)
- Oceans 2.0 API filter:
spectrogramColourPalette = 1 - Grayscale (perceptually balanced - from MATLAB Gray)
- Oceans 2.0 API filter:
spectrogramColourPalette = 2 - Sequential Dark Blue to Dark Red (perceptually balanced - from mycarta.wordpress.com/color-palettes)
- Oceans 2.0 API filter:
spectrogramColourPalette = 3 - Sequential Burgundy to Beige (perceptually balanced - from mycarta.wordpress.com/color-palettes)
- Oceans 2.0 API filter:
spectrogramColourPalette = 4 - Sequential Fuschia to Chartreuse (perceptually balanced - from mycarta.wordpress.com/color-palettes)
- Oceans 2.0 API filter:
spectrogramColourPalette =
...
5
Upper Colour Limit:
- Default (use device calibration values)
- Oceans 2.0 API filter:
upperColourLimit= -1 - Specific upper colour limit (value between 0 and 140)
- Oceans 2.0 API filter:
upperColourLimit= 0 to 140
Lower Colour Limit:
- Default (use device calibration values)
- Oceans 2.0 API filter:
...
lowerColourLimit= -1- Specific lower colour limit (value between 0 and 140)
- Oceans 2.0 API filter:
lowerColourLimit= 0 to 140
Formats
Plots are available in PNG format.
Oceans 2.0 API filter: extension={png}