...
Data files for Kongsberg Mesotech Rotary Sonar instruments are described here. In the SCAN mode, the sonar repeatedly images a particular sector of the of its full 360 degree sweep range. The parameters are set with a central azimuth and a half-width. To see these settings, navigate to the device details from step 2 of data search, i.e. http://dmas.uvic.ca/DeviceListing?DeviceId=12007, and then go to the attributes tab. If the scan mode is not active, no scan data products will be generated. The full SWEEP data product is also available and is always active when the device is active. This is why users may find the sweep data product returning data, while the scan mode returns with a 'No data found' message. The availability of the scan mode data product may be less than that indicated by the data availability graph.
Oceans 2.0 API filter: dataProductCode=KSDP
Revision History
- 20120519: Initial SMB product released
- 20121002: Scan Mode enable
- 20140730: MAT-file and plotting products added
...
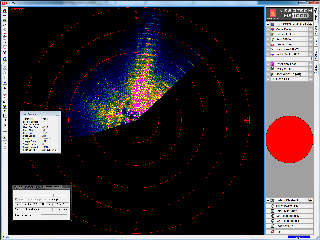
In some cases, the software does not display the reverse direction of the scan very well. Wiggle your mouse and the display will update. (It appears to be a limitation of the software and graphical capability of one's computer, we're investigating.) The fast forward function of the software is very useful to view a large amount of data quickly.
Oceans 2.0 API filter: extension=smb
MAT
MAT files (v7) can be opened using MathWorks MATLAB 7.0 or later. The file contains two structures: Meta and Data.
...
Additional tuples for heading, location maybe added in the future.
Oceans 2.0 API filter: extension=mat
PNG / PDF
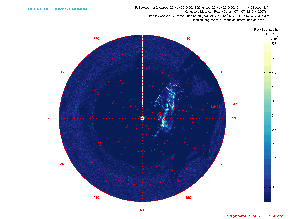
The PNG / PDF plot data products mirror the display of the Kongsberg MS1000 software, but break each rotation into separate plots so that no data is overwritten or has to be averaged. The raw backscatter amplitude is plotted as contained in the MAT file: 16 bit data ranges from 0 to 65535, 8 bit ranges from 0 to 255. The backscatter data is not calibrated. For each source SMB file, there are two types of plots returned: a plot of the sonar pointing / heading angle as a function of time (called 'SonarAngle') and multiple backscatter polar plots (called 'Backscatter'). The SonarAngle plot has numbered annotations showing the start of each corresponding numbered Backscatter plot. In the examples below, the SonarAngle plot shows that five Backscatter plots will be created for this SMB source file. The PDF version of this data product will group this plots into a single PDF file with multiple pages. Please note that these examples are of test tank data; real data looks much better.
...
The algorithms for detecting each rotation and for making the plots are somewhat complex. Contact us if you are interested in the source code for these plots, which would be useful for analyzing the data from the MAT files.
Oceans 2.0 API filter: dataProductCode={png,pdf}
GIF
The GIF is a combination of PNG plots seen above excluding the sonar pointing / heading angle as a function of time plot. The GIF plots are broken up daily so they run through every PNG in a day.
Oceans 2.0 API filter: extension=gif
Discussion
To comment on this product, click Add Comment below.