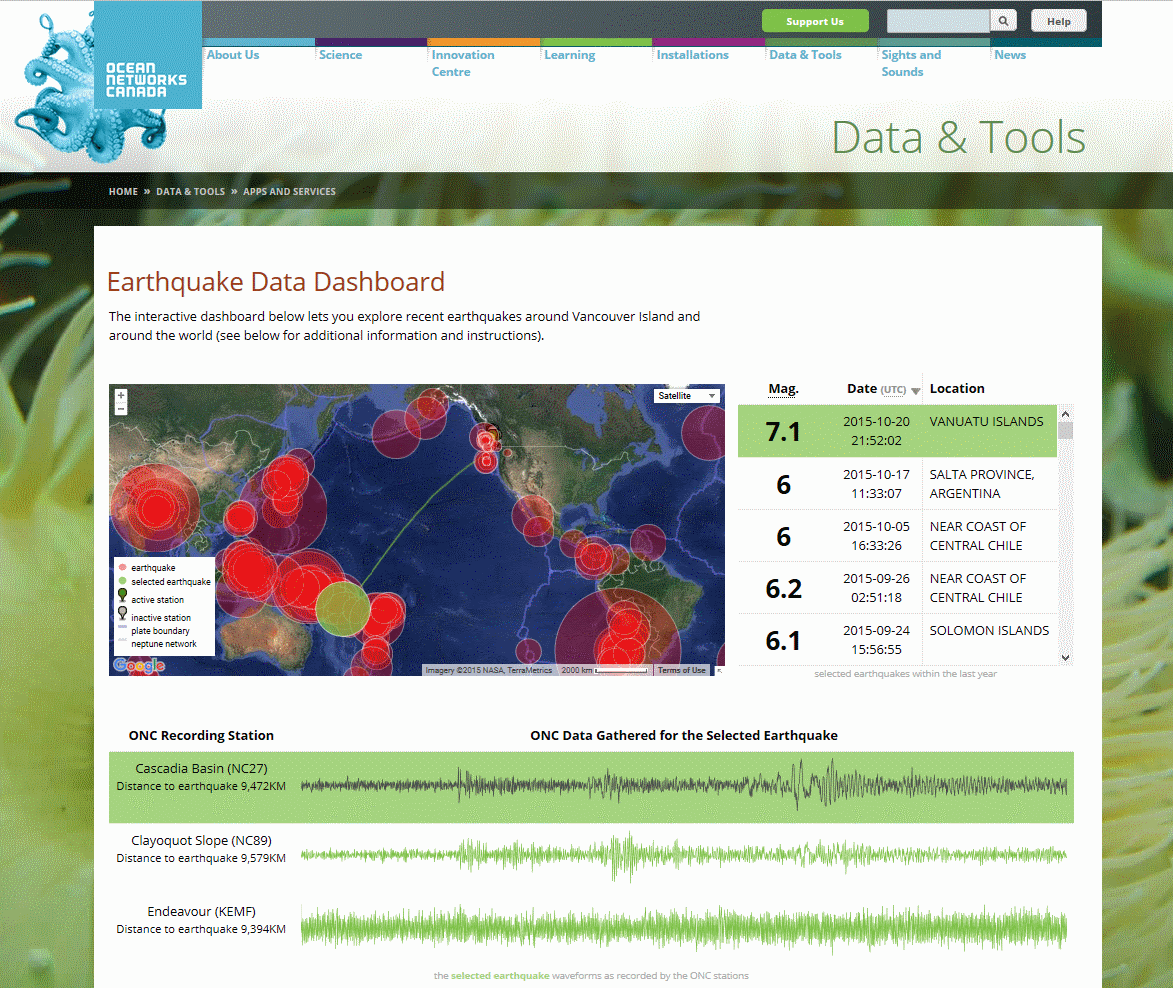
What is it?
This page displays earthquakes detected by Ocean Networks Canada seismic sensors. Larger earthquakes (over 4.0 on the Richter scale) from the previous 12 months are displayed, with a timeline of one hour of seismic data previewed below.
Register an Oceans 2.0 account & get more features
Personal history - remember searches, save plots, create annotations.
Share: send plots to colleagues and friends.
Community: join research working groups, share ideas for experiments and data analysis.
and more (click for details)
| Panel | ||||||||||||
|---|---|---|---|---|---|---|---|---|---|---|---|---|
| ||||||||||||
|
| Panel | ||||||||||||||
|---|---|---|---|---|---|---|---|---|---|---|---|---|---|---|
| ||||||||||||||
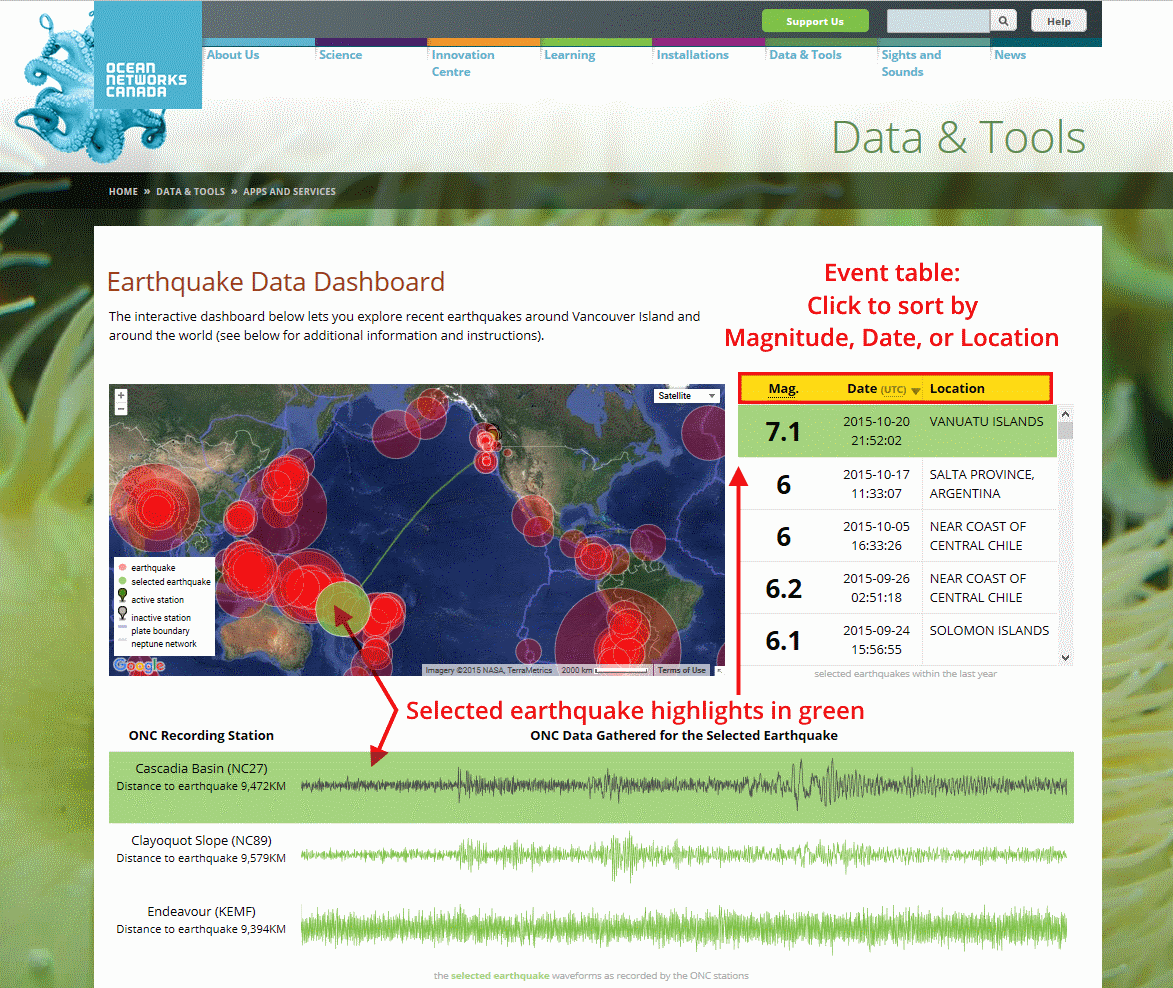 The Event table (right) displays Magnitude, Date, and Location. Click on the column header to change the sort order. Click on any row will update the map and the seismic display for the selected earthquake. |
| Panel | ||||||||||||
|---|---|---|---|---|---|---|---|---|---|---|---|---|
| ||||||||||||
Hovering your mouse over the data display shows the time difference from the event, to the detection at Ocean Networks Canada's array. |
