...
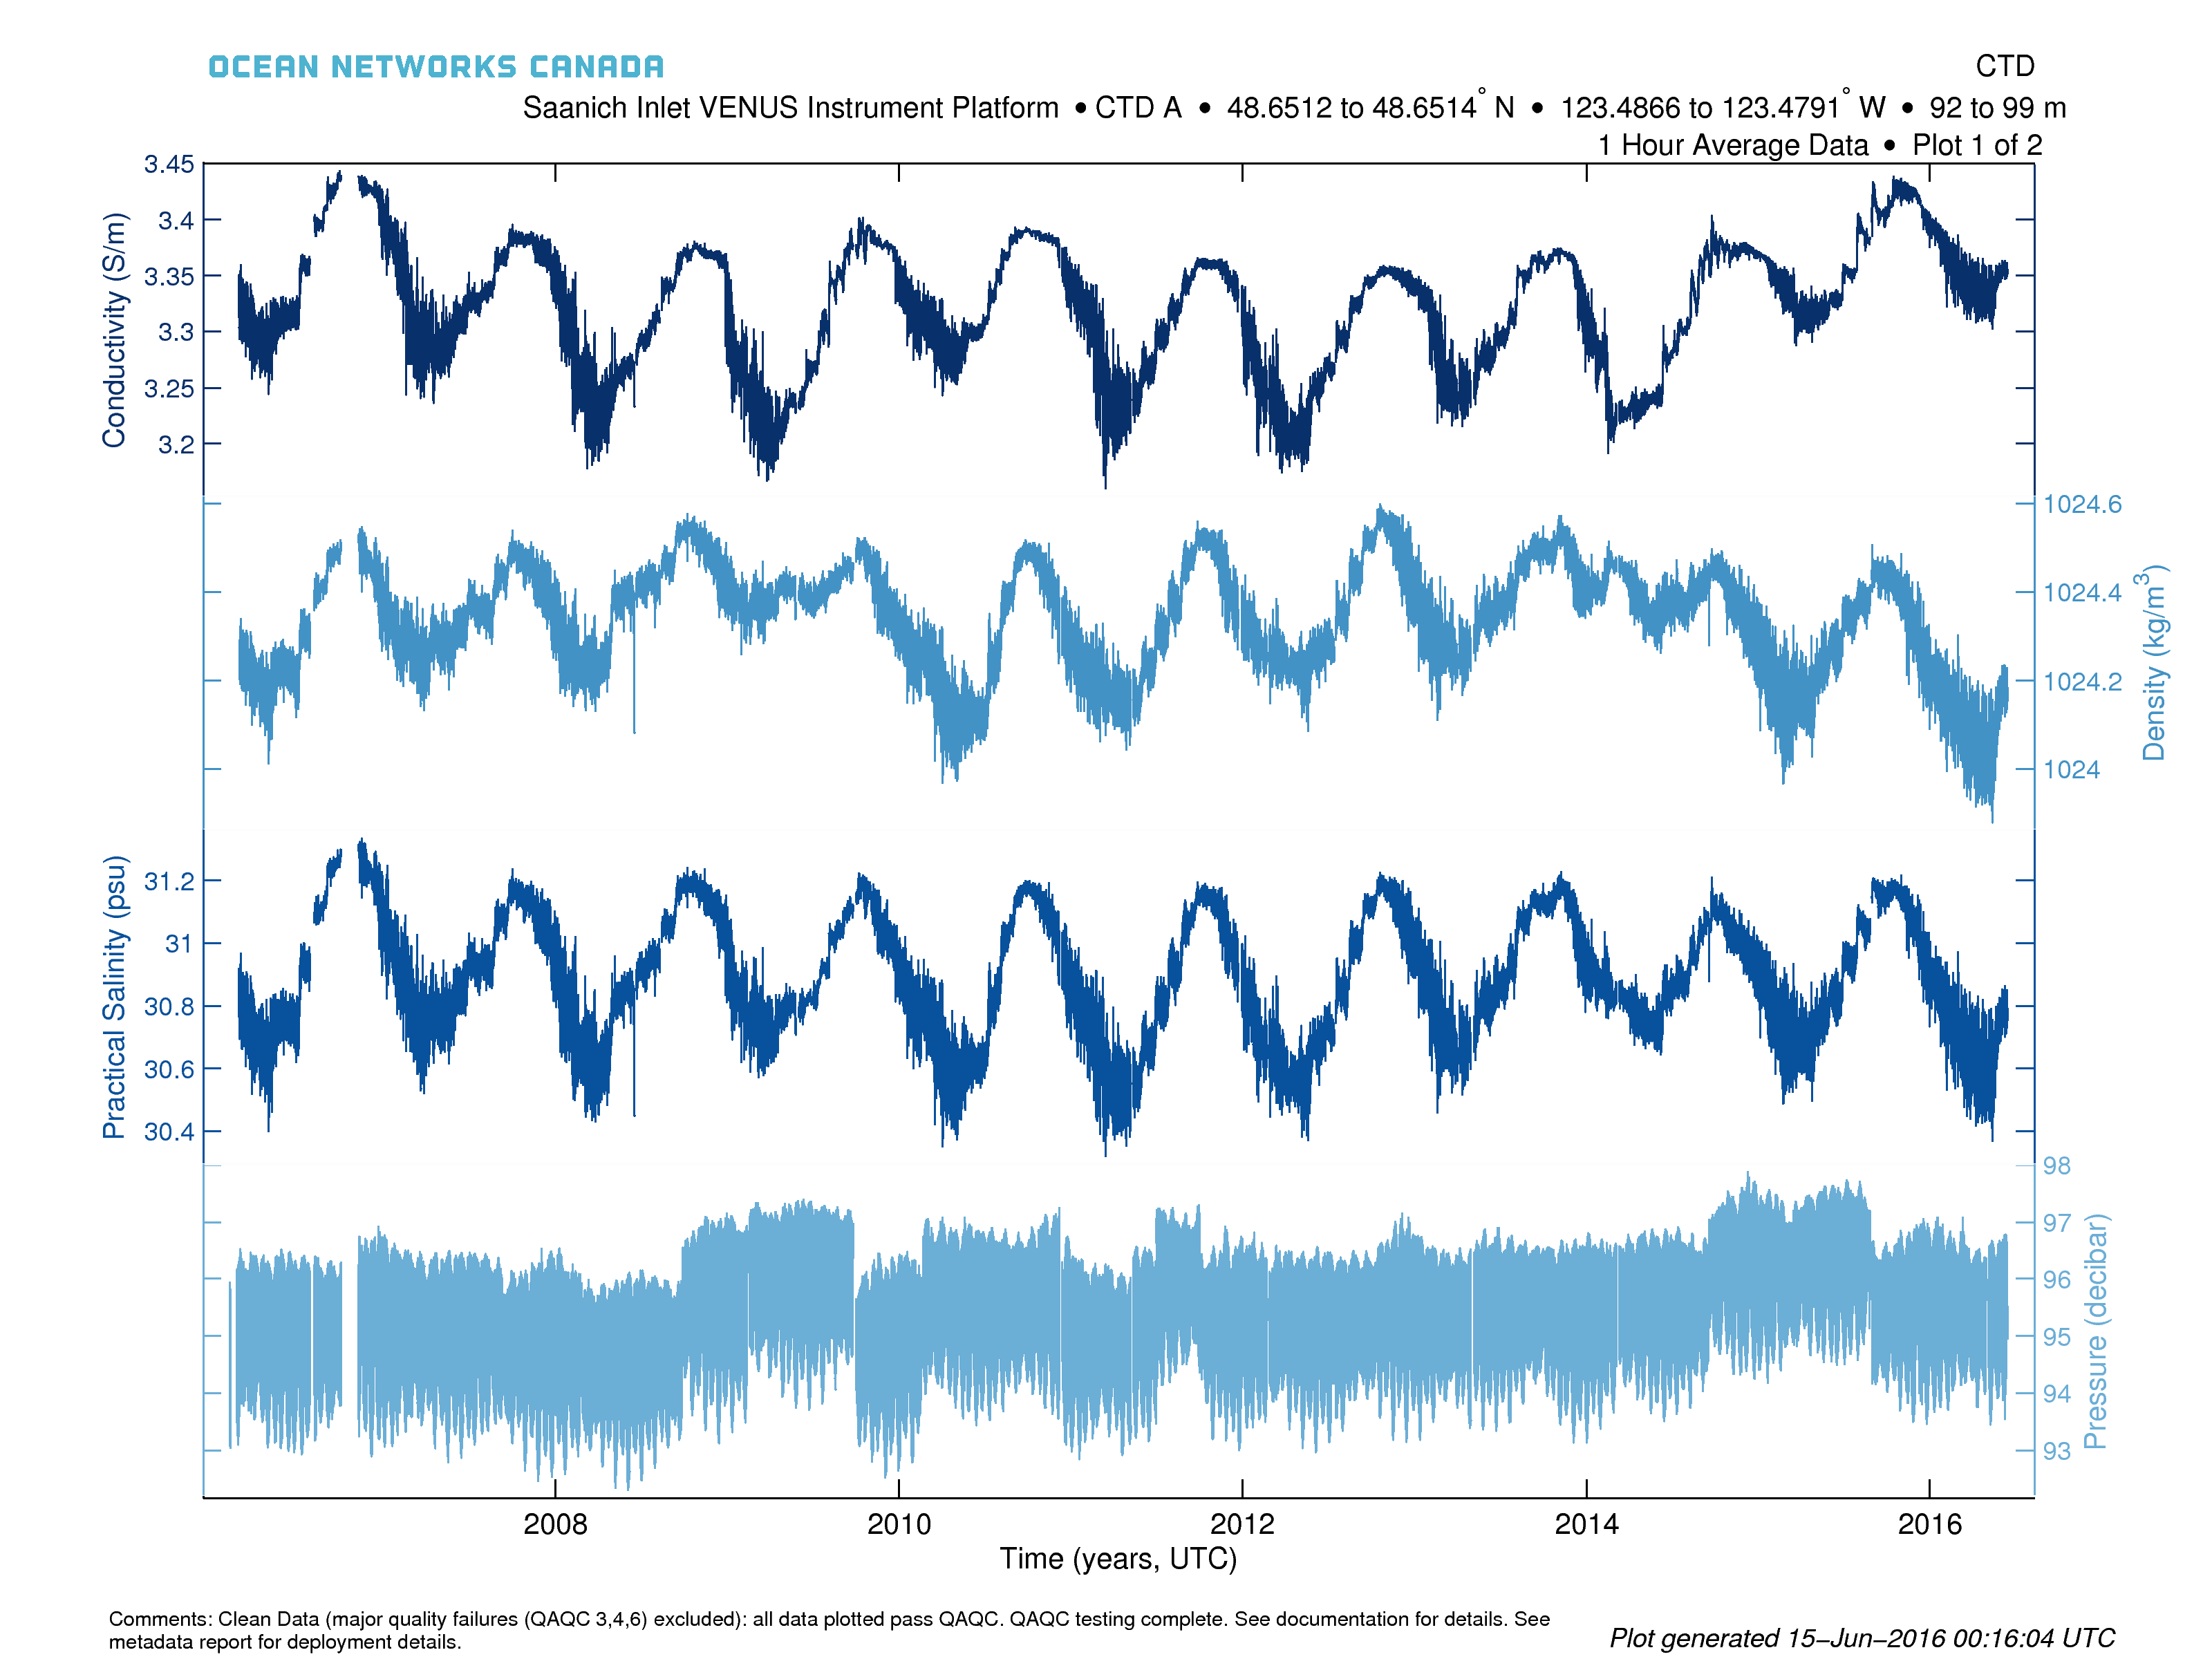
Device-level or multi-sensor plots consist of multiple sub-plots, each with independent Y-axes and a common time axis. Each plot can have up to 5 sensors as sub-plots and if there are more than 5 sensors to plot, additional plots will be created, all with the same time axis (if the PDF format is selected, plots will be multiple pages within the same PDF file). Data is plotted as a simple line plot with alternating hues of blue colours to distinguish the sub-plots and Y-axes. Sensors are ordered alphabetically. Comments below the plot provide QAQC information. Here is an example (instruments by location search, one hour average):

| Include Page | ||||
|---|---|---|---|---|
|
| Anchor | ||||
|---|---|---|---|---|
|
...