| Tip |
|---|
Register for an Oceans 3.0 account & get more features- Personal history — remember searches, save plots, create annotations.
- Prolonged storage — logged in users searches persist for 21 days after the search completes. Searches run by anonymous users (i.e. users who are not logged in) only persist for 3 days.
- Unlimited time range — logged in users have no time range limit. Searches run by anonymous users are limited to 90 days time range for each request.
- Access across different computers — you can start a data request on one computer and download it later to a different computer. Searches by anonymous users are tied to their browser via a cookie (clear your browser's data and you'll lose your searches).
- Support — being logged in with an account with a valid email address allows ONC support to contact you if anything goes wrong with your search requests or with the data itself. It also allows us to respond to help requests. We aim to respond to support requests and problems within the business day.
- Share — send plots to colleagues and friends.
|
data processing and visualization for both scalar and complex data products. Results with accompanying metadata reports can be published in scientific papers. Many more instrument types are searchable than in Data Preview, including hydrophones,
sonars, vertical profilers, ship data and cameras. Documentation on data products is here: Data Products Home.
Using a shopping cart model, you can create
and download multiple searches at your convenience. If you log in with an Oceans
3.0 account, your previous data searches are retained.
Why is this useful?
Searching massive data sets over time can generate huge data downloads. Data Search gives you options such as averaging, Min/Max and selecting Clean or Raw data to control the amount of data you wish to process for downloading.
A search history lets you start a search while at one location (e.g., work) and then check in on that search from somewhere else (e.g.,
Personal history - remember searches, save plots, create annotations.
Share: send plots to colleagues and friends.
Community: join research working groups, share ideas for experiments and data analysis.
and more (click for details)
| Panel |
|---|
| bgColor | #dddddd |
|---|
| titleColor | #eeeeee |
|---|
| borderWidth | 1 |
|---|
| titleBGColor | #205081 |
|---|
|
 Image Removed
| solid | | title | 1. Data Search: Observatories |
|---|
|
| borderStyle | solid |
|---|
Step 1: Browse Data Sources |
open Data Search, the list and map |
display all data source locations in the |
archive. Choose Instruments by Location, Instruments by Category, or Properties (measurements) by Location.
 Image Added Image Added
(click to enlarge) |
| Panel |
|---|
| borderColor | 030303 |
|---|
| bgColor | #dddddd |
|---|
| titleColor | #eeeeee |
|---|
| borderWidth | 1 |
|---|
| titleBGColor | #205081 |
|---|
|
| solid | | title | 2. Data Search: |
|---|
|
| borderStyle | solid |
|---|
 Image Removed Image Removed
Select 'Filter On:' from the navigation tree to chose an instrument category. After you make a selection, the map adjusts to show the location in greater detail. |
|
Step 2: Use the Filters. The filter panel at right lets you refine the list of Instruments and Measurements by filtering for Depth, Time Period, and Property.
Click the blue triangle to hide and show the filter panel.  Image Added Image Added
(click to enlarge) |
panel | | bgColor | #dddddd |
|---|
| titleColor | #eeeeee |
|---|
| borderWidth | 1 |
|---|
| titleBGColor | #205081 |
|---|
|
| borderStyle | solid |
|---|
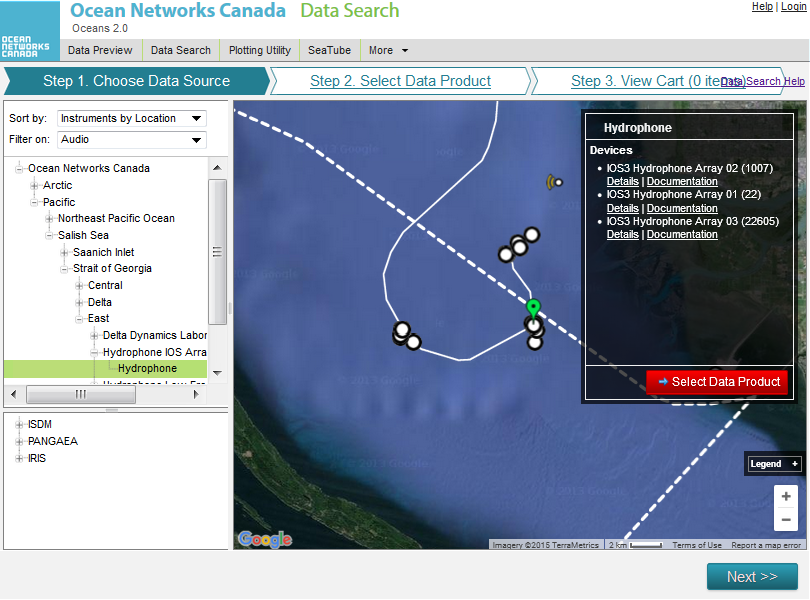 Image Removed
In this example, Audio filters for instruments that collect audio data. The tree now displays results of this type. When you select a location, it highlights in green and displays details on the info box on the right. Click on 'Select Data Product or click 'Next'. |
Step 3a: Choose an Instrument or Property from the list. After you make a selection, a dark grey box lists all Devices (instruments) that have measured your Property of interest at that Location. Click the red Select This Data Source button to continue.
 Image Added Image Added
(click to enlarge) |
| Panel |
|---|
| bgColor | #dddddd |
|---|
| titleColor | #eeeeee |
|---|
| borderWidth | 1 |
|---|
| titleBGColor | #205081 |
|---|
|
| borderStyle | solid |
|---|
|
Step 3b: Choose an Instrument or Property from the map. You can also zoom the map and click icons on the map to select instruments. After selecting an Instrument or Property, click the red Select This Data Source button to continue.
 Image Added Image Added
(click to enlarge) Demo Video |
 Image Removed Image RemovedClick on Step 2: select data product. The screen displays a listing of devices historically deployed, a graph of data availability, data product formats, and delivery options. |
| Panel |
|---|
| bgColor | #dddddd |
|---|
| titleColor | #eeeeee |
|---|
| borderWidth | 1 |
|---|
| titleBGColor | #205081 |
|---|
|
7. Data Search- Download Selected | | borderStyle | solid |
|---|
| 4. Data Search: Data Product Selection |
|
Step 4: Choose Data Products The Data Product Selection tab lets you decide how you want the data prepared. For the instruments listed over your requested time period, you can choose data product formats, and delivery options.* When you have made your selections, click Add to Cart.  Image Added Image Added
(click to enlarge) Demo Video *Note: sometimes when multiple products are chosen, the processing options are not applied to all. If this occurs, you can choose to process and download them one at a time |
 Image RemovedAfter your search has completed, you can download the result and open with a zip compression program that supports 64-bit file fornat
| Panel |
|---|
| bgColor | #dddddd |
|---|
| titleColor | #eeeeee |
|---|
| borderWidth | 1 |
|---|
| titleBGColor | #205081 |
|---|
|
| solid | | title | 5. Data Search: Checkout |
|---|
|
solid |  Image Removed
Click on Step 3: view cart. A list of three carts is displayed: open, in progress, and completedStep 5: View the Cart On the View Cart tab, your requested data products appear in the Open Cart box. Click the checkbox for each product you want processed and packaged. Review your search parameters, and when you're satisfied click |
Checkout All. Your products will be processed and bundled into a zip file for you. If the process job is very large, you can log out and return later to download the finished file.
 Image Added Image Added
(click to enlarge) Demo Video |
| Panel |
|---|
| bgColor | #dddddd |
|---|
| titleColor | #eeeeee |
|---|
| borderWidth | 1 |
|---|
| titleBGColor | #205081 |
|---|
|
| solid | | title | 6. Data Search- Download or Delete Selected |
|---|
|
| borderStyle | solid |
|---|
 Image Removed
Step 6: Download and/or DeleteAt any point you can review your search cart. |
You can decide to delete your request before, during or after searches are executed.
Nothing is downloaded to your computer |
until you click the Download button. If you are logged in to your account, completed product files are stored for you to download up to 14 days later.
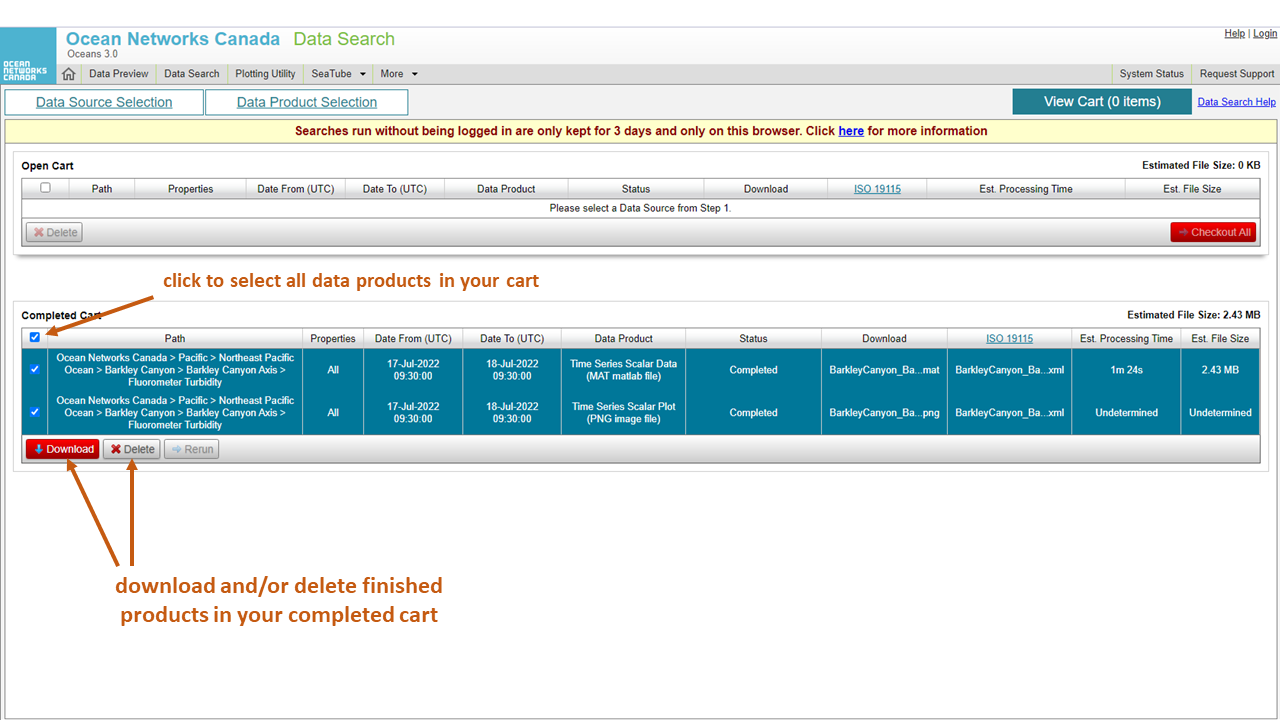 Image Added Image Added
(click to enlarge) Demo Video
|
| Panel |
|---|
| bgColor | #dddddd |
|---|
| titleColor | #eeeeee |
|---|
| borderWidth | 1 |
|---|
| titleBGColor | #205081 |
|---|
| borderStyle | solid |
|---|
| title | 7. Data Search- Opening Search Results |
|---|
|
Step 7: Opening Search Results
After your search has completed, you can download the result. If you requested more than one file, they will be bundled into a zip file. Open it with a zip compression program that supports 64-bit file format.
 Image Added Image Added
(click to enlarge) |