For time series scalar mobile plots:
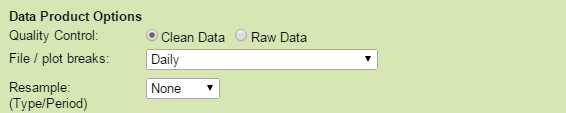
Quality Control: Clean Data
For time series scalar data, selecting this option will cause any data values with quality control failures (QAQC flags 3 and 4) to be replaced with NaNs. Because NaNs cannot be plotted, quality control failures will be excluded from any plots under the clean option. This is the default option.
Oceans 3.0 API filter: dpo_qualityControl=0
Quality Control: Raw Data
When this option is selected, raw data will be supplied in the data products: no action is taken to modify the data. In general, all scalar data is associated with a quality control flag. For plots, data that fail quality control are marked on the plot with coloured data points and/or flag markers for emphasis.
Oceans 3.0 API filter: dpo_qualityControl=1
File / plot breaks: Daily
When this option is selected, the file or plot will break every daily at a prescribed times (not necessarily on midnight). The search will return with one plot per day of data. This is the default option.
Oceans 3.0 API filter: dpo_fileplotbreaks=1
File / plot breaks: None (files break on size limits only)
When this option is selected, the file or plot will not break unless it becomes too large. (Only available for Clean Data option).
Oceans 3.0 API filter: dpo_fileplotbreaks=0
Resample (Type/Period)
When the file breaking option is set to None and data quality is set to clean, this option is available so that users may generate long time series plots. 1-minute averaging will generate a good plot for one month of data (need at least 5 days of data to begin to fill the plot, at least 1 month for 5-minute averaging). The plots will break into multiple files if there's more than 36 days of data for 1-minute averaging, 180 days for 5-minute averaging (limited by matlab's ability to plot and render coloured markers).
Oceans 3.0 API filter: dpo_resample=none
File-name mode field
'clean' is added to the file-name when the quality option is set to clean data.