For echosounder data products only. Currently used by the ASL Acoustic Profiler Time Series and BioSonics Time Series data products.
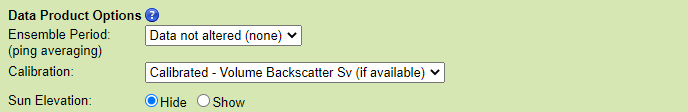
Ensemble Period (ping averaging)
This option will cause the search to perform the standard box-car average resampling on the data. 'Boxes' of time are defined based on the ensemble period, e.g. starting every 15 minutes on the 15s, with the time stamp given as the center of the 'box'. Acoustic pings that occur within that box are averaged range or bin-wise, and the summary statistics, such as 'Data.nPingsAcquired' (from ASL time series MAT files) are updated. This process is often called 'ping averaging'. The process uses log scale averaging, which involves backing out the dB scale to pressure, compute the weighted average, and then compute the dB scale again. Weighted averages are used when raw files bridge an ensemble period and when the data is already an ensemble or ping average.
New files are started when the maximum records per file is exceeded (files will not exceed 1 GB of memory when loaded), or when there is a configuration, device or site changes. In the case where there is data from either side of a configuration change within one ensemble period, two files will be produced with the same ensemble period, the same time stamps, but different data. Users may use the ensemble statistics on the number of pings or samples per ensemble to filter out ensembles that do not have enough data. (As an aside, we do this by default with clean averaged scalar data - each ensemble period needs to have at least 70% of it's expected data to be reported as good.)
For plotting data products, the requested ensemble period may be overridden to prevent image aliasing (one ensemble period is prevented from being smaller than one pixel). Also, the requested ensemble period also selects if the plots are broken daily (none option) or allowed to span multiple days (breaks still occur at configuration changes and internal data/memory limits).
The default value for this option is no averaging, meaning the data is not altered.
Some echosounders are configured to do ping averaging during acquisition, so the data you request with with 'Data not altered (none)' could already be averaged. To determine if the echosounder is averaging data as it is acquiring it, check the device details page (e.g. http://dmas.uvic.ca/DeviceListing?DeviceId=22608, go to the additional attributes tab) or check the data products: see the comment field in the plots or the Config structure in MAT files, look for Config.p in the ASL time series (BioSonics echosounder don't usually do any onboard averaging). Available ensemble periods are 0.5, 1, 5, 10, 15 and 60 minutes.
Data not altered
Oceans 3.0 API filter:
dpo_ensemblePeriod=030 Seconds
Oceans 3.0 API filter:
dpo_ensemblePeriod=201 Minute
Oceans 3.0 API filter:
dpo_ensemblePeriod=605 Minute
Oceans 3.0 API filter:
dpo_ensemblePeriod=30010 Minute
Oceans 3.0 API filter:
dpo_ensemblePeriod=60015 Minute
Oceans 3.0 API filter:
dpo_ensemblePeriod=9001 Hour
Oceans 3.0 API filter:
dpo_ensemblePeriod=3600
File-name mode field
Selecting an ensemble period will add 'Ensemble' followed by the ensemble period. For example '-Ensemble600s'.
Calibration
This option will apply the calibration to the data, when the calibration coefficients are available. The calibration calculation and coefficients are supplied by the manufacturer. See the device details page (additional attributes tab) to see the coefficients, see the instrument documentation page, or contact us for more details. These values are also provided in the MAT file products; see the Config / Cal structure for ASL data products and the data.snd.rxee structure for BioSonics data products.
The default value is to apply calibration and calculate the Volume Backscatter when available. Users may also choose a Target Strength calculation for calibrated data The former is used to estimate bio-mass of schools or aggregations, with the latter is useful with single large targets such as predatory fish (for more information see the format descriptions). The uncalibrated option will provide the raw data only. Raw data has units of raw counts, which are proportional to the received acoustic pressure.
Calibrated - Volume Backscatter Sv (if available)
Oceans 3.0 API filter:
dpo_calibration=1Calibrated - Target Strength TS (if available)
Oceans 3.0 API filter:
dpo_calibration=2Uncalibrated (raw pressure)
Oceans 3.0 API filter:
dpo_calibration=0
File-name mode field
'CalibratedSv' or 'CalibratedTS' will be added if all the channels of the device were successfully calibrated (for Volume Backscatter or Target Strength, respectively).
Sun Elevation
This option applies to echosounder plots only. If 'Show' is selected, it appends a graph of the Sun's elevation over time below the acoustic data, such a plot is useful to correlate the acoustic data with dial (daily) and tidal effects, such as zooplankton migrations.
The default will not add a plot of sun elevation.
Hide
Oceans 3.0 API filter:
dpo_sunElevation=0Show
Oceans 3.0 API filter:
dpo_sunElevation=1
File-name mode field
No affect on file-name.