CODAR Data Availability Plots
About CODAR
CODAR (Coastal Ocean Dynamics Applications Radar) is a technology that allows the measurement of surface ocean current velocities at a distance using the Doppler shift of reflected radio waves. The term “CODAR” is frequently used as a generic term, but it is strongly associated with CODAR Ocean Sensors, a California company that manufactures them. A more general term for CODAR is “HF (High-Frequency) Coastal Radar”.
CODAR works on the principle of Bragg scattering from ocean surface waves. Bragg scattering returns a signal to the transmitting antenna only when the ocean waves are moving either directly towards or directly away from the antenna.
Bragg scattering from ocean waves is also highly wavelength-specific; any given system is sensitive only to ocean waves with wavelengths one-half the wavelength of the radio waves it transmits. The Salish Sea / Strait of Georgia CODAR system (device details) used by ONC is a 25 MHz model. A radio frequency of 25 MHz corresponds to a radio wavelength of 12 metres, so the CODAR system is sensitive to ocean wavelengths of 6 metres. If ocean waves of this wavelength are entirely absent, the CODAR system is unable to measure surface currents. In practice, there is virtually always some wave energy in the 6-metre band, so this is generally not a problem. In extremely calm conditions, however, the data quality can be reduced because of the resulting lower signal-to-noise ratio.
The principle of Bragg scattering dictates that virtually all of the radio signal received by a CODAR antenna is being reflected back from ocean waves of a particular wavelength. The reflected signal is Doppler-shifted to higher or lower frequencies, depending on whether the ocean wave is moving, respectively, toward or away from the antenna. In the absence of ocean currents, this Doppler shift gives a measurement of the wave speed, just as a police radar gun measures the speed of a vehicle on the highway. If ocean currents are present, however, the Doppler shift gives a measurement of the wave speed PLUS the speed of the ocean current towards or away from the antenna. Because the speed of deep-water waves is known for a given wavelength, the wave speed can be subtracted from the total measured speed, resulting in a value for the speed of the ocean current alone.
The equations used in calculating ocean current velocities from the Bragg-scattering signal assume that the ocean waves being measured are “deep-water” waves--that is, that their wavelengths are less than twice the water depth. As depth decreases beyond this point, the waves will increasingly take on the character of “shallow-water” waves, and the assumptions used in calculating the ocean currents will become less and less valid. For a 25 MHz system, then, ocean currents measured in water depths of less than 3 metres should be viewed with suspicion. Note that the daily tidal range in the Strait of Georgia is on the order of 3 metres, so this effect will be time-varying for the current deployment.
CODAR Stations and Combiners
The individual CODAR stations are listed as individual devices. For example, the original two CODAR stations were at the Westshore Coal Terminal in Tsawwassen and at the Iona Wastewater Treatment Plant, near Vancouver Airport. The stations are displayed in the search tree under “Westshore Coal Terminal (VCOL)” and “Iona (VION)”, respectively. Each station measures the radial velocities of ocean surface currents; that is, towards and away from the station's antenna. The stations have been placed in locations such that their areas of coverage overlap considerably. In the overlapping region, it is possible to combine the radial data from the two stations into “total” velocities that may be resolved into their true north-south and east-west components. In this way, the stations have radial and raw data, while we list the combined data products on a separate, virtual, device, nominally found in the search tree as "Oceanographic Radar System" at the same level as the station search tree locations (for example: https://data.oceannetworks.ca/DataSearch?location=SOGCS&deviceCategory=OCEANOGRAPHICRADAR).
CODAR Data Products Overview
The CODAR stations and combiner virtual device have different data products available to them. The CODAR stations have manufacturer produced .RUV files (radial surface velocity data) and raw data formats: CODAR Raw RNG Data, CODAR Raw CSS Data, CODAR Raw RNG Data. The CODAR combiner virtual devices have manufacturer produced .TUV files (total surface current data) and CODAR grid files. Both types of devices have manufacturer produced PNG and GIF plots of their respective radial and total surface velocities. Also available are the ONC-developed CODAR Quality-Controlled Surface Currents data products for all stations and combiners, plus a related CODAR Data Availability Plot, showing the areal coverage of data with or without ONC quality control.
Oceans 3.0 API filter: dataProductCode=CODARDA
The data formats and processing algorithms are described in detail below.
Revision History
- 20203017: Initial CODAR Data Availability Plots released
Data Product Options

Quality Control: ONC Quality Control (On)
This is the default. This option will plot the data availability after the data undergoes all of the QC processes that produce the CODAR QC data products.
Oceans 3.0 API filter: dpo_qualityControl=1
Quality Control: Manufacturer Original Data (Off)
Alternatively, users may use this option if to show the data availability without any of the QC processes that produce the CODAR QC data products. For radial stations, this is essentially the data availability in the RUV files. For combiner stations, totals are calculated with the CODAR QC data product code, reproducing the manufacturer's TUV source data files, which is then used to calculate the data availability.
Oceans 3.0 API filter: dpo_qualityControl=0
File / Plot Breaks: None (break configuration changes or memory limits only)
This is the default. This option will not break the plot / file unless required to on configuration changes or memory size limits so that users will see the data availability in one plot for the request time range.
Oceans 3.0 API filter: dpo_filePlotBreaks=0
File / Plot Breaks: Daily / Weekly / Monthly / Yearly
These options will break the summation of availability at the specified interval unless interrupted by configuration changes or memory size limits. These breaks occur on the beginning of the selected interval: midnight for daily, Sunday midnight for weekly, midnight on the 1st for monthly, midnight on January 1st for yearly. Time ranges of over which availability is calculated are always shown on the plots.
Oceans 3.0 API filter: dpo_filePlotBreaks=1 (Daily), 2 (Weekly), 4 (Monthly), 5 (Yearly)
Formats
The CODAR data availability plots are processed on-the-fly from the source RUV files (from CODAR stations with radial surface velocities). The formats are described below. All of these data products have _Availability added near the end of their filenames, in addition to the _CLEAN and break mode modifier as described in the data product options section above.
PNG and PDF plots
PNG and PDF files contain a graphic representation of both station radial and combined total velocities, depending on what device/station the data product was requested from. Station files with radial currents end in the four letter CODAR site code (e.g. -VCOL_Availbility_CLEAN), while the combined files (with total velocities) end in -TOTALS_CLEAN. The PDF variant bundles all the PNGs (up to a file size limit) in a single vector-graphics PDF with a filename corresponding to the extents of the PNGs. Breaks between plots are determined by the File / Plot breaks option described above.
Oceans 3.0 API filter: extension=png,pdf
Example plot from Strait of Georgia CODAR Array:
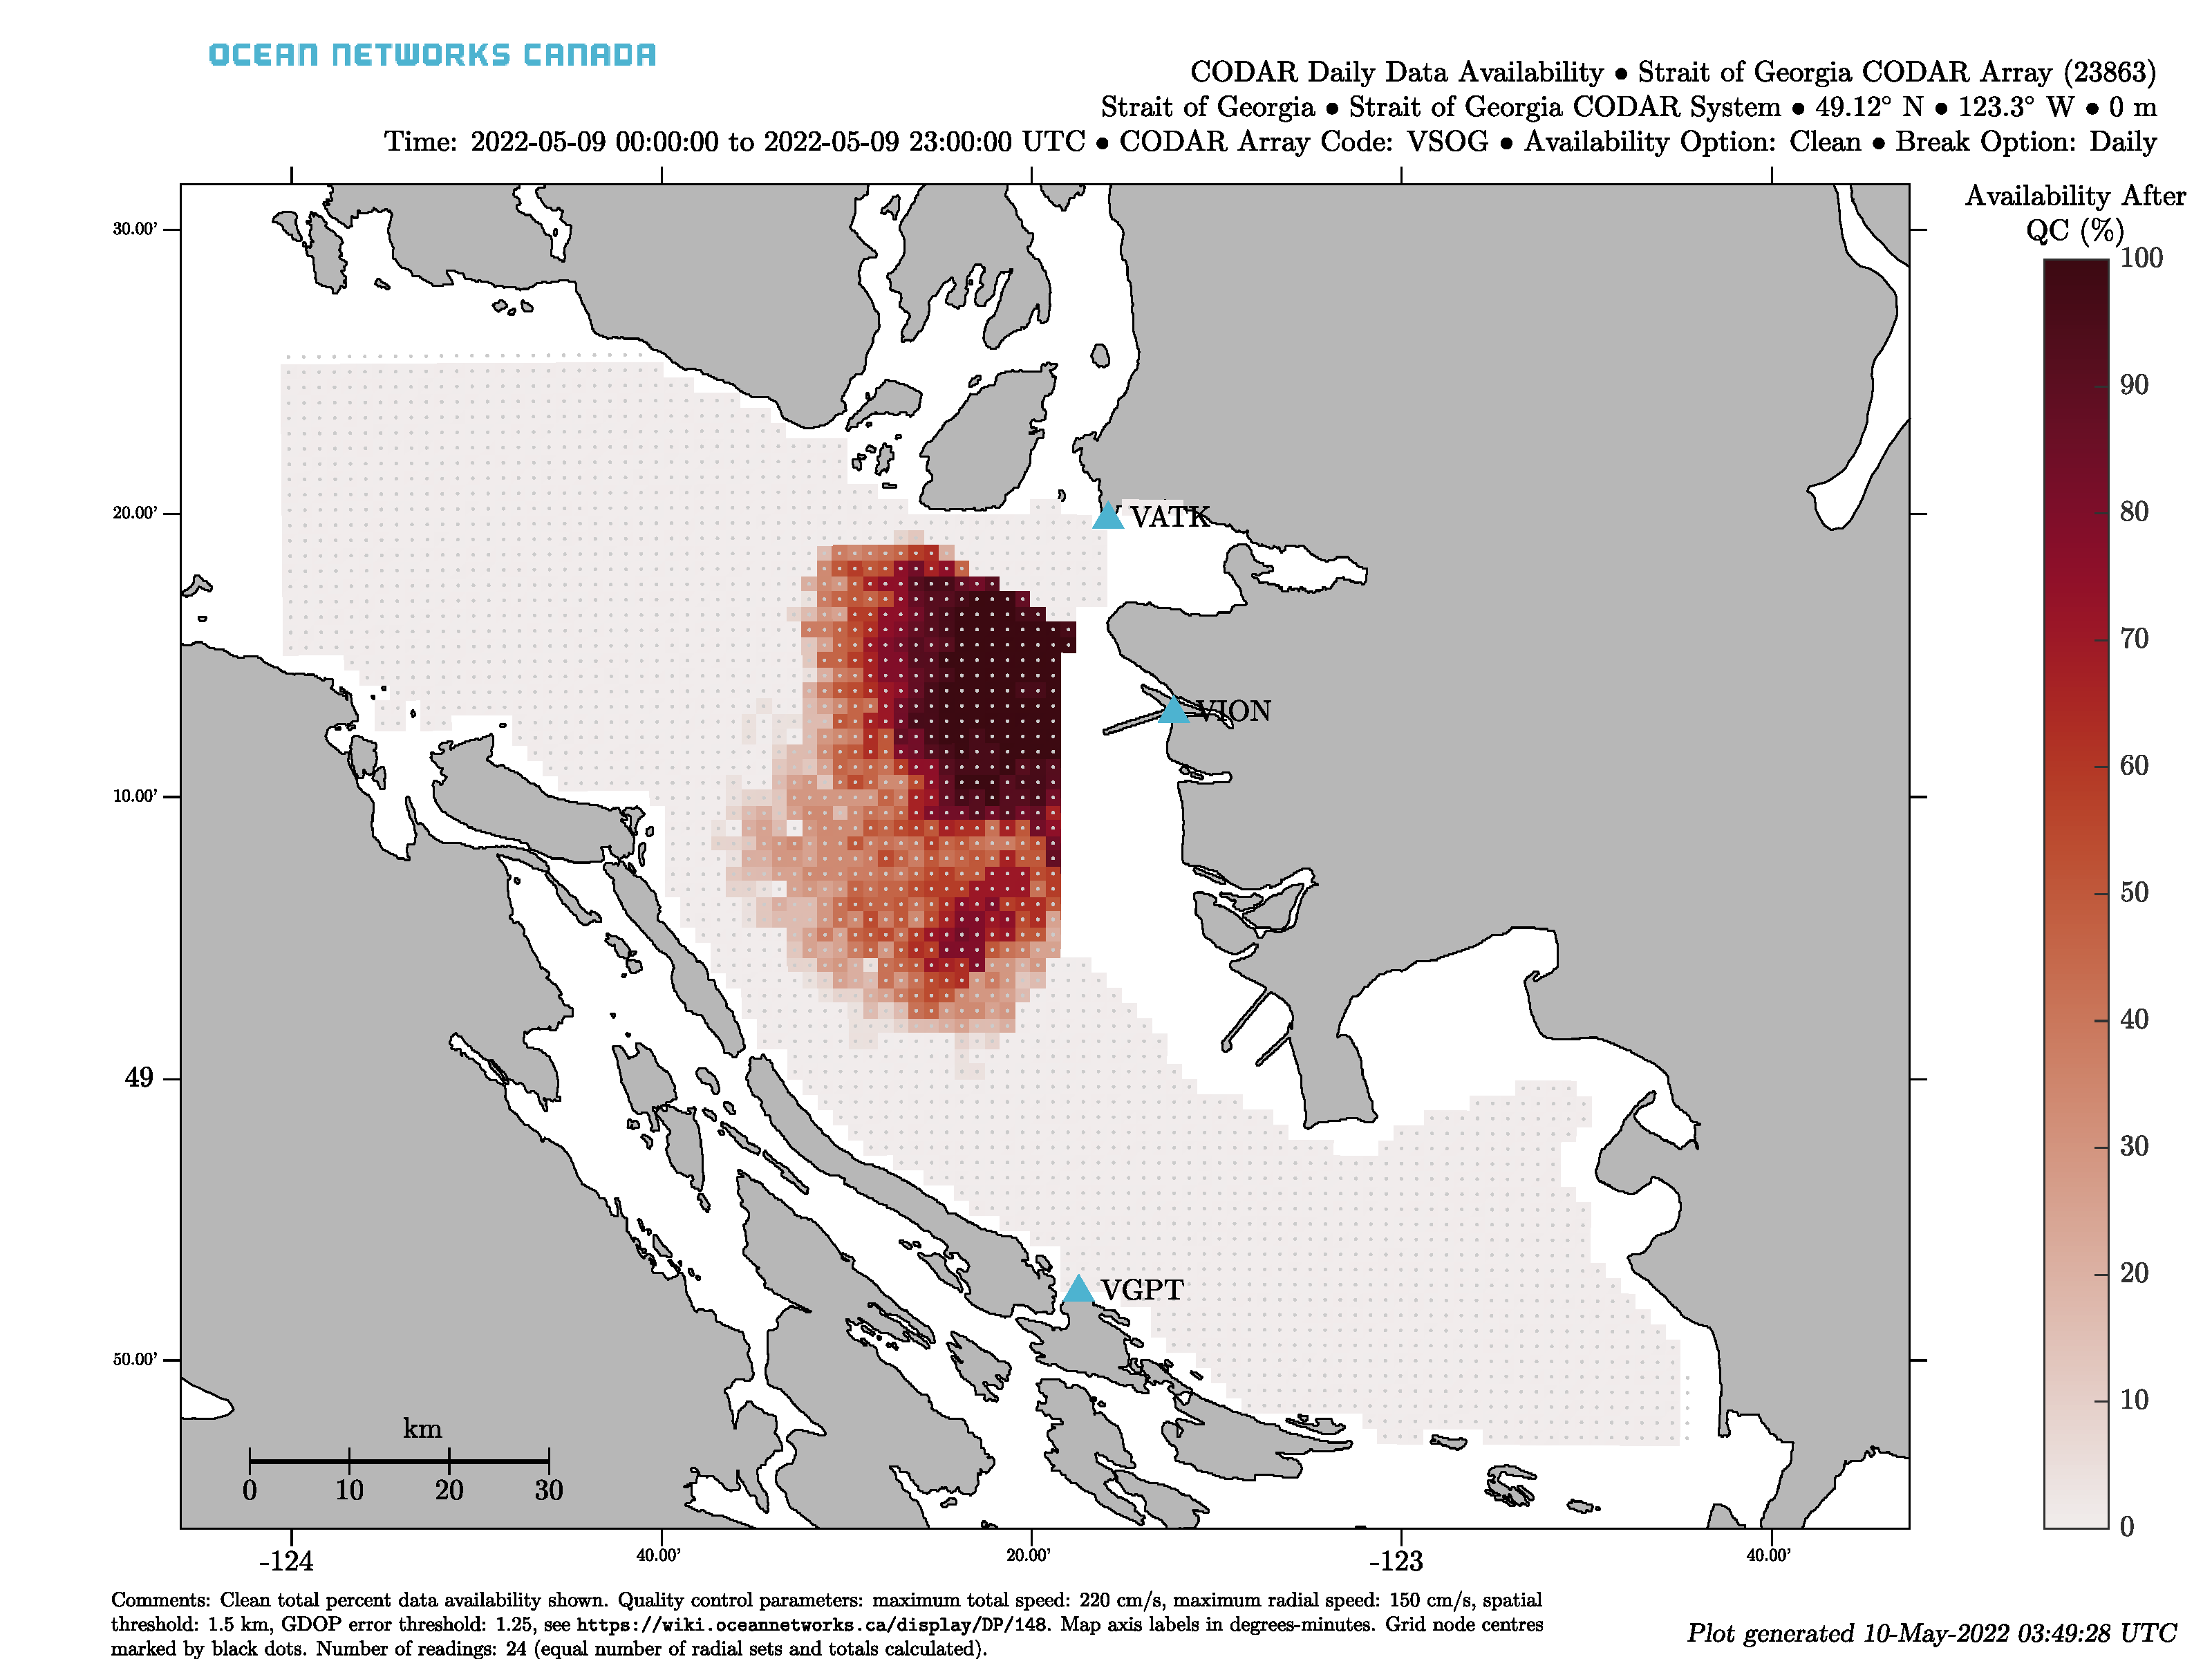
Data Availability
Straight of Georgia Deployment
Radial data is available from the Westshore Coal Terminal station (VCOL) beginning on on November 24, 2011 and from the Iona Wastewater Treatment Plant (VION) beginning August 1, 2012. “Total” current data files are also available beginning August 1, 2012. Radial and total data files are generated hourly.
CSS and CSQ/Range data are available for each station for the same time period as the corresponding radial data. The exception to this is the CSQ files from the VCOL station in the five and half months between the date that acquisition started and June 10, 2012. An unnoticed default setting on the VCOL computer resulted in the CSQ files from this period being overwritten (apart from the CSQ files from February 6-7, 2012, which were recovered).
The VION station was switched from retaining CSQ files to retaining Range files on December 4, 2012. VCOL was switched to retaining Range files on December 19, 2012. Because VCOL is on a wireless router with limited bandwidth, CSQ/Range files are not fetched over the network, but rather are physically transferred via portable hard drive when site visits are made. As a result, there may be a lag of several months between acquisition and availability of CSQ/Range files from VCOL.
The range of high-frequency radio waves is greatly reduced over fresh water compared to the range over salty, highly-conductive water. For this reason, during the spring freshet, when the surface water in the Strait of Georgia is much less salty, one or both of the CODAR stations may return little or no current data in the area of overlap, resulting in no total current vectors being available. This will vary from year to year, but at the time of writing (May, 2013) it appears that total current vectors may be unavailable from early May to as late as July each year.
As of May 2016, the data acquisition framework was switched to the stations/combiners model. All of the formats will be available from then onward. The older files will migrate from the old scheme to the new devices over the next few months. The old scheme used a single device with multiple file mode fields to distinguish the stations. The new scheme is more flexible for expansion (we have added CODAR stations in Prince Rupert and there's potential for much more).
Discussion
To comment on this product, click Write a comment... below.